Unbounded: Labor Hours
Time Is the Ultimate Currency
The most important resource for progress is the time we invest in the future. The time we spend thinking, imagining, learning, creating, and building a life beyond survival. That is where future wealth is created: in ideas, skills, families, and futures. People need time to learn something, start something, care for children, change careers, build relationships, experiment, recover, participate in their community, and solve problems.
time → human development → knowledge → wealth.
We measure prosperity in income, GDP, productivity, and consumption. But underneath all of them is a more fundamental question: how much of a person’s effort must be spent securing the foundations of a good life?
Throughout history, our collective technology and resources have grown astonishingly. Yet many people still have little time available for learning, creating, and building a better future. Compared with previous generations, many people today need to invest more time in survival. The most direct observation of this is in the time invested in securing housing. It takes longer now to secure a home than it did 50 years ago.
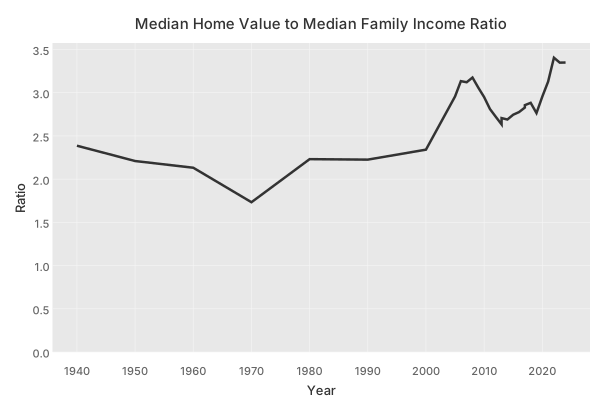
The labor time required to own a house far exceeds the ratio. If you are only able to save 5% of your income, then the time required is at least 20x the ratio. The bottom 90% of earners save roughly 4% of their income. 2 Typically one would rent while saving up for a deposit, take out a mortgage, then pay interest and principle over 30 years. The ratio is a way to compare the relative labor investment required in the past to now. In the 70s, a family saving at 5% could buy a home with a 10% deposit after 4 years Now it takes 6 years to save for a deposit. Essentially the labor time required to own a home is 50% higher today, regardless of the exact way you go about obtaining the home. It takes working longer today to secure a home than it did in the past.
We can see the direct effects of this in the age of first time buyers, and whether mortages are paid off before retirement. 3
| Era | First Buy | Mortgage Ends | Years Debt-Free Before Retirement (65) |
|---|---|---|---|
| 1990s | Age 28 | Age 58 | 7 years |
| 2020s | Age 40 | Age 70 | –5 years (still paying) |
Today, the median home owner needs more time to save for a deposit and will still have a mortgage when they retire.
The Squeeze in Hours
Many households are working hard and still falling behind. Paychecks cover rent, food, and bills, but not much else. There is little left for savings, investment, or emergencies. Full-time work only buys survival, not progress.
“The trouble with the rat race is that even if you win, you’re still a rat.” – Lily Tomlin
Wages, housing, and basic services do not all rise together. Fixed resources get bid up by people with surplus capital. The result is lower affordability and lower social mobility. People experience rent pressure, delayed family formation, and debt dependence. Affordability is a crisis for many individuals even when aggregates look fine.
Above a certain income level, people can buy assets and compound wealth. Below that level, people are mostly trying not to fall behind. At the top, wealth is held in assets that continue to compound. At the bottom, nearly all income is committed to consumption.
What is the threshold where people can accumulate home equity and retirement savings?
The answer varies widely with geography, household size, housing situation, and other factors. According to the SmartAsset Salary Needed to Live Comfortably Study (2026), a single adult needs to earn at least $80K to live comfortably, and the threshold exceeds $100K in nearly half of the states, reaching $150k in the most expensive cities.4 The median individual income was $45K in 2024 for all individuals age 15+.5 16.7% of individuals earned over $100K in 2024. This suggests that roughly 80% of individuals earn less than the income needed for a comfortable life.
For families, the median family income is $105K, while living comfortably requires earning $190K, the threshold exceeds $200K in 40 states, reaching $410K in the most expensive cities. $207k is the top 20% of family incomes.6 This suggests that roughly 80% of families earn less than the income needed for a comfortable life.
The Golden Age of Capitalism
Prosperity does not require extreme wealth concentration. The period 1945-1985 was one of the strongest periods economically and socially. Many households could afford a rising standard of living. Growth was broadly shared. It was a rare period in history. High taxation and broad public investment coexisted with strong growth.
Top income tax rates during this era ranged from 70% to 91%. Yet economic growth remained robust because that tax revenue funded infrastructure, research, and education that improved productivity. The economy flourished because capital was cycled through broad-based investment. 7
The effective tax rate on the wealthiest was higher, but so was their return on invested capital because public goods were abundant. High taxes paired with productive public investment creates a positive feedback loop.
What Changed
From the 1980s onward, the rules changed. Tax policy became more favorable to capital and high incomes. More wealth accumulated among people who already owned assets. That wealth competed for a limited supply of land, housing, and other assets, pushing prices higher. At the same time, labor bargaining power weakened. Productivity rose, but worker compensation did not keep pace. The gains from economic growth flowed increasingly toward asset owners.
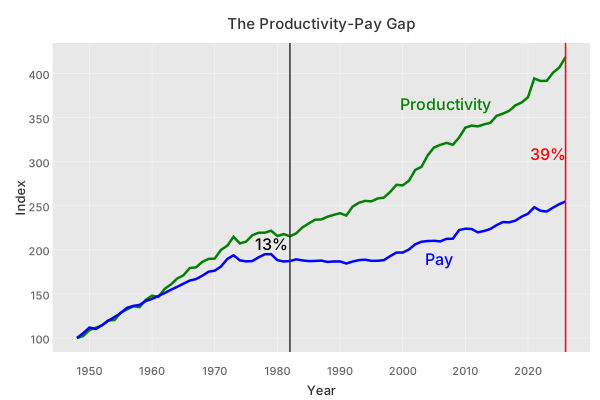
Productivity measures economic output per hour of work. From 1948 until 1982, worker pay rose in step with productivity. Since 1982, productivity has continued to rise, but worker compensation has lagged behind. An increasing share of the gains from productivity has gone to owners rather than workers.
Productivity gains increase wealth for those who already own assets. Asset owners experience rising asset prices as wealth. People without assets receive a smaller share of economic gains while paying more to acquire the assets they need. People without assets experience rising asset prices as rising costs.
Housing is the clearest manifestation of this. Home prices have risen faster than median household income, making homes increasingly expensive relative to what people earn.
How We Got Here
Tax policy choices favored capital over labor. Over decades, policy choices changed the distribution of wealth and bargaining power. Yet political debate focuses on the symptoms rather than the structure. Politicians argue about culture, identity, immigration, crime, inflation, and short-term relief. These issues matter, but they also distract from a simpler question: Who owns the assets, and who participates in economic growth?
Lower taxes on the wealthy and weaker institutions are allowing more of the gains from growth to concentrate. We built a system in which wealth compounds faster for those who already own it than ordinary wages can grow for those who do not. Wealth continues to flow upward, concentrating ownership and political power into fewer hands. We got here through choices. We can get somewhere else through choices too.
When I was a kid, I could spend an entire afternoon playing Taipan, a trading game where I sailed between ports, bought cargo, avoided pirates, and tried to build my fortune. I never looked at the clock. But when my Mum asked me to spend five minutes cleaning up my room, suddenly time moved differently. Five minutes felt endless. The value of time depends on what that time is buying you.
These days I worry about my nephews and nieces. They face more challenges than my brothers and I ever had. How can that be, when the economy and technology have advanced so far? Surely the younger generation should have it easier, with better prospects? It wasn’t until I looked at the labor costs of essentials that I realized what they are up against. We really did have it easier. The ratios changed. Each hour worked buys less. Someone can work the same 40-hour week as their parents did, while their effective labor burden is higher because essentials consume more of their income. My generation always had plenty of time to build the lives we wanted. The next generation has only five minutes to spare.
My nephew now has a son. When I think about his future, I don’t want to imagine a world where hard work is no longer enough to build a secure life. There isn’t much time left before ownership and security become out of reach for an entire generation. A future where people work hard their entire lives and die with nothing is not a future we should accept. That generation will be left with only two options: radical, destructive change, or a lifetime of resignation. We must find an alternative.
Time is precious. A good society should give people time for exploration, creation, family, and growth. When people are forced to spend all their time maintaining survival, society loses human potential. A society that traps people in maintenance mode wastes human capability.
Footnotes
Home values are median values for owner-occupied homes from the U.S. Census Bureau’s decennial census historical series for 1940-2000 and American Community Survey table B25077 one-year estimates for 2005-2024. Family income is the midpoint of the Census Bureau’s second- and third-income quintiles from Historical Income Table F-1, covering 1940-2024.↩︎
See Saez, Emmanuel, and Gabriel Zucman. “Wealth Inequality in the United States since 1913: Evidence from Capitalized Income Tax Data.” Quarterly Journal of Economics, 2016.↩︎
National Association of Realtors First-Time Home Buyer Share and Median Age.↩︎
SmartAsset, “Salary Needed to Live Comfortably in the US: 2026 Edition,”. State-level analysis for single adults and families of four using the 50/30/20 budget rule.↩︎
U.S. Census Bureau, Current Population Survey, PINC-01, “Selected Characteristics of People 15 Years and Over, by Total Money Income,” 2024.↩︎
U.S. Census Bureau, Historical Income Tables: Families, Table F-1, “Income Limits for Each Fifth and Top 5 Percent of Families,” 2024.↩︎
See Historical US Federal Individual Income Tax Rates & Brackets, 1862-2025 for the postwar top marginal rate history and the broader context of the mid-century tax regime.↩︎
Series from EPI’s Productivity-Pay Tracker, based on Bureau of Labor Statistics data. It compares net productivity for the total economy with compensation (wages and benefits) for private-sector production and nonsupervisory workers. Both series are indexed to 1948 = 100. Data and methodology.↩︎