A Little Plotje

Plotje is a plotting library for Clojure. Plots are plain data. Plots are easy to construct, inspect, reuse, and share. Plotje renders plots to files, Hiccup, and Java2D.
The suffix -je is a Dutch diminutive, roughly meaning “little.” “Plotje” is pronounced roughly as “PLOT-yuh.”
Plotje was created and is maintained by Daniel Slutsky.
What Plotje can do
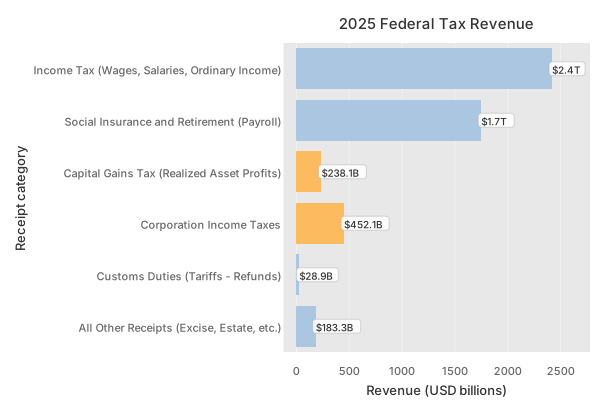
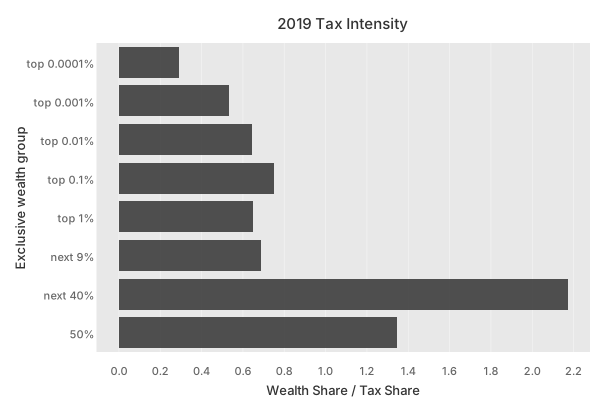
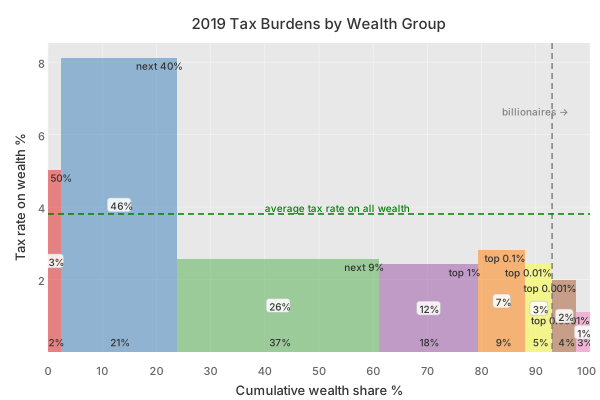
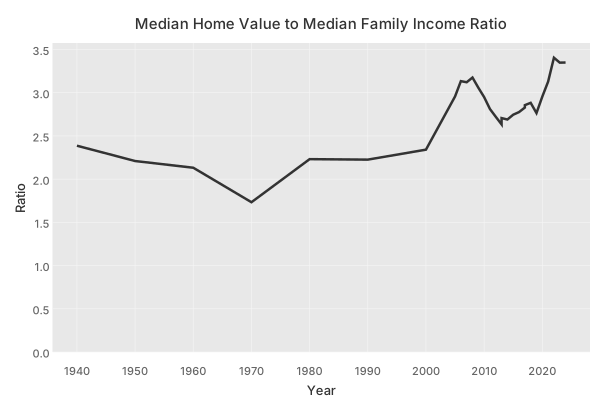
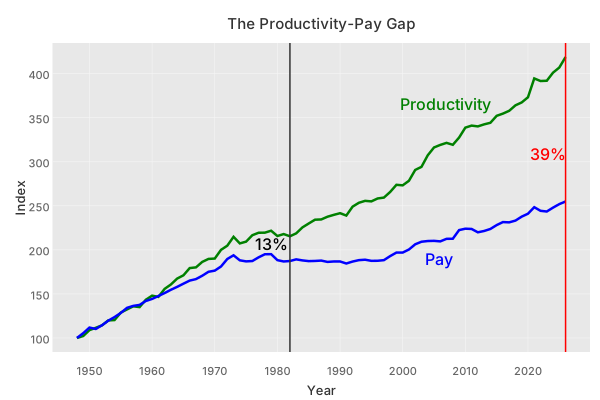
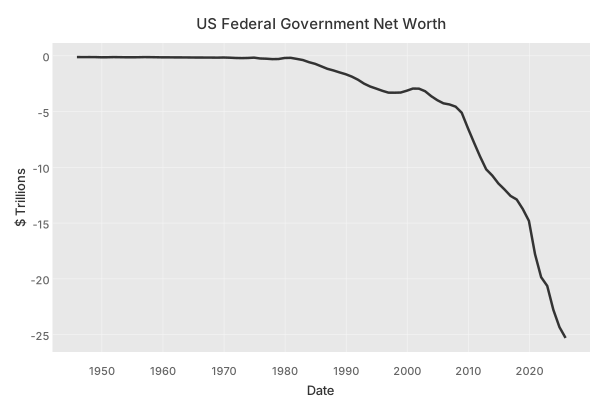
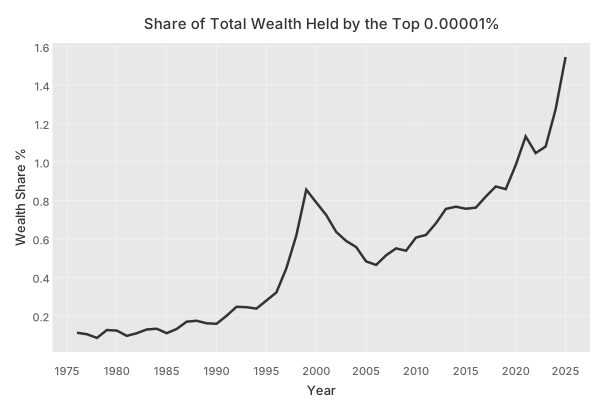
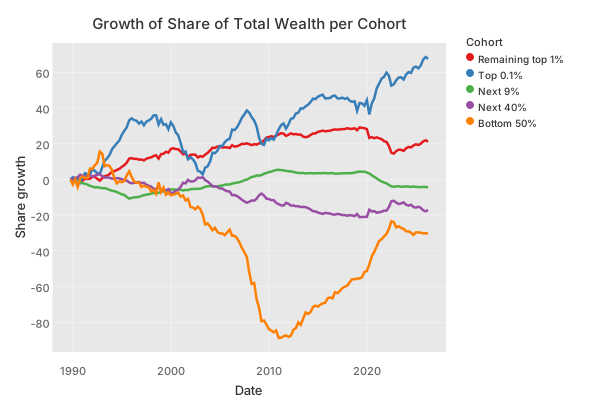
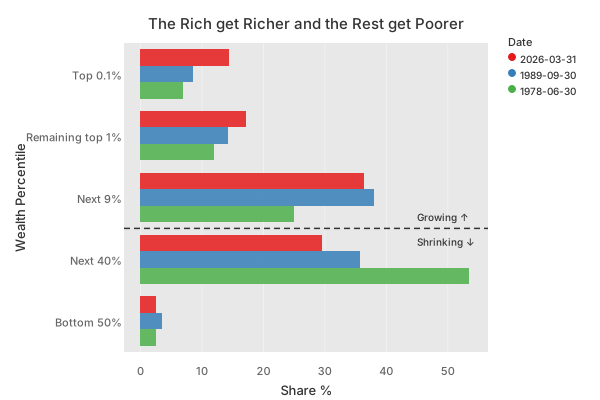
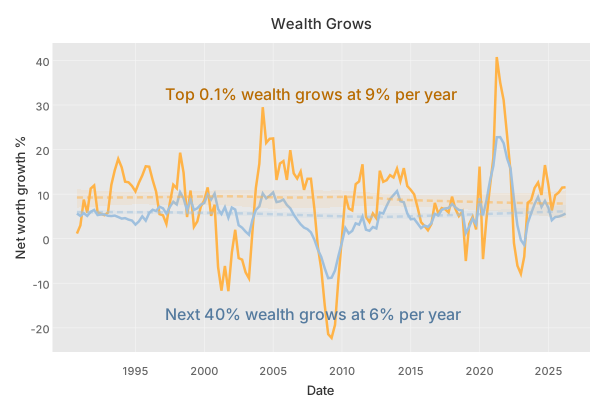
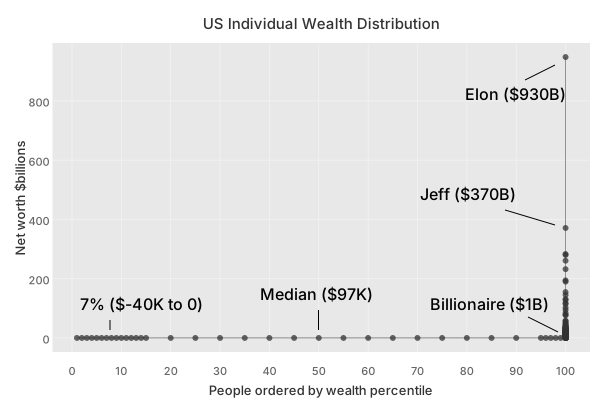
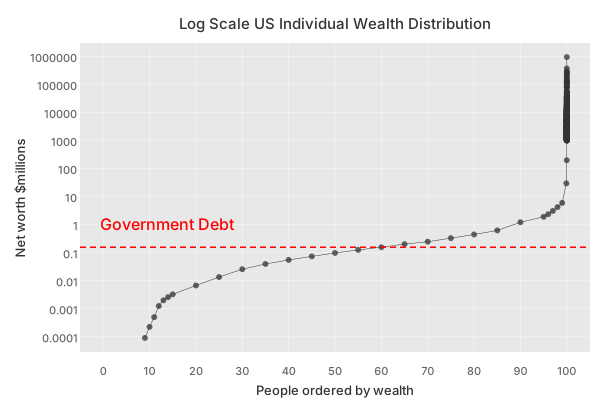
Here are a few charts I made with it for the Unbounded series on wealth concentration. Click to enlarge.
A quick tour
Add org.scicloj/plotje to your dependencies 
(require '[scicloj.plotje.api :as pj])The lay-* functions add a layer, such as bars, lines, or points:
(pj/lay-bar {:x ["a" "b" "c" "d" "e"]
             :y [1 2 4 8 16]})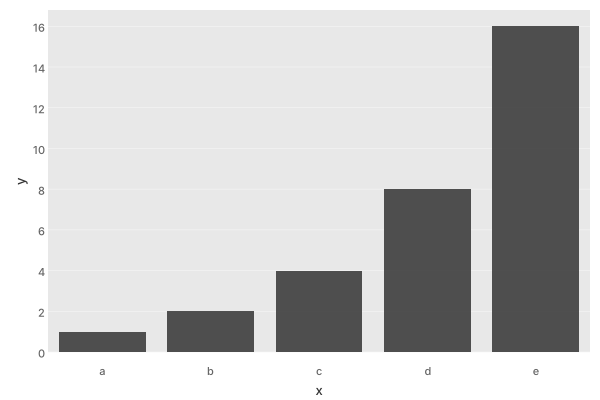
(pj/lay-line {:x ["a" "b" "c" "d" "e"]
              :y [1 2 4 8 16]})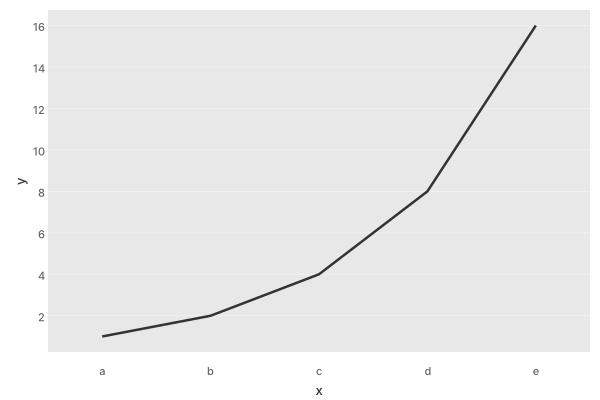
(pj/lay-point {:x ["a" "b" "c" "d" "e"]
               :y [1 2 4 8 16]})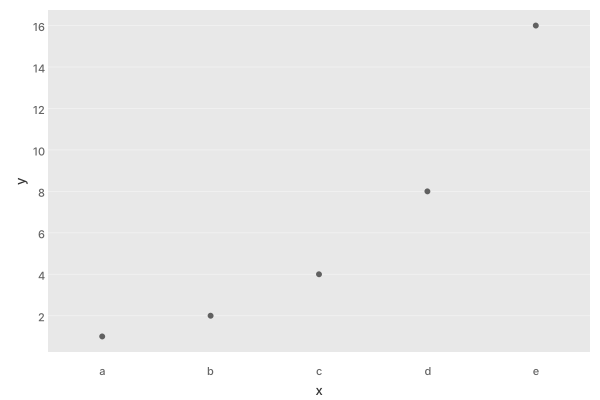
Layers compose: add points to a line to show both the trend and the individual observations.
(-> {:x ["a" "b" "c" "d" "e"]
     :y [1 2 4 8 16]}
    (pj/lay-line)
    (pj/lay-point))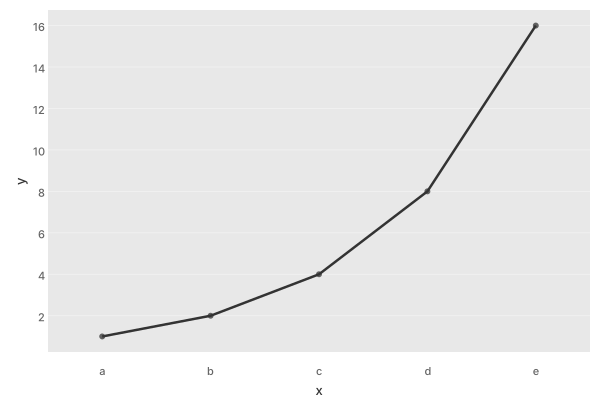
When the data has more than two columns, say which ones to use:
(-> {:x [1 2 3 4 5]
     :y [1 2 4 8 16]
     :z [16 8 4 2 1]}
    (pj/lay-line :x :z))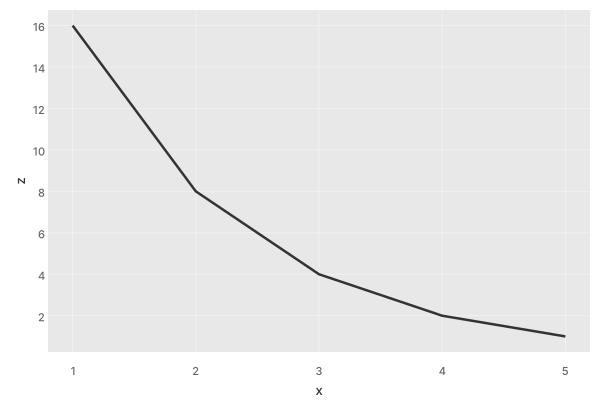
Or plot several series together:
(-> {:x [1 2 3 4 5]
     :y [1 2 4 8 16]
     :z [16 8 4 2 1]}
    (pj/lay-line :x [:y :z]))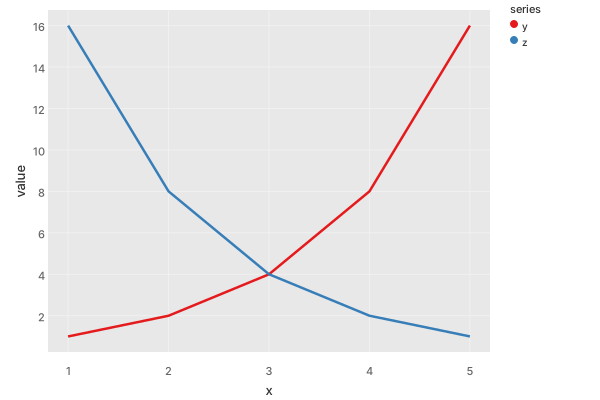
Add a title with pj/options:
(-> {:x [1 2 3 4 5]
     :y [1 2 4 8 16]
     :z [16 8 4 2 1]}
    (pj/lay-line :x [:y :z])
    (pj/options {:title "Two series"}))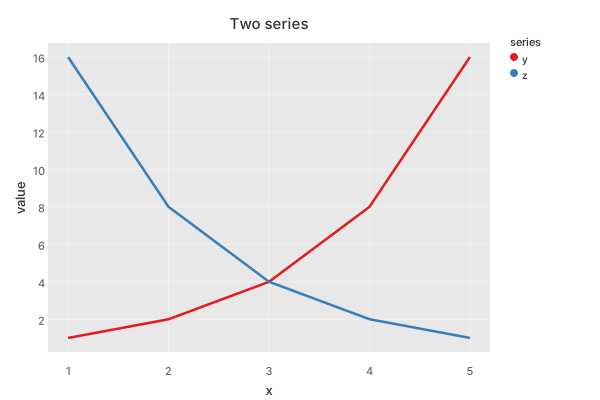
A histogram shows the distribution of a column. Summing a few random numbers gives a bell-like shape:
(defn multivars []
(repeatedly 500 #(+ (rand) (rand) (rand) (rand))))(-> {:x (multivars)}
(pj/lay-histogram))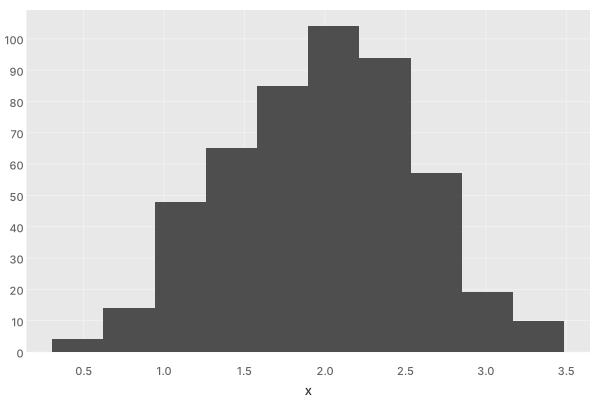
Map a column to color to compare groups:
(defn ab []
(repeatedly 500 #(rand-nth ["a" "b"])))(-> {:x (multivars)
:y (multivars)
:category (ab)}
(pj/lay-point {:color :category}))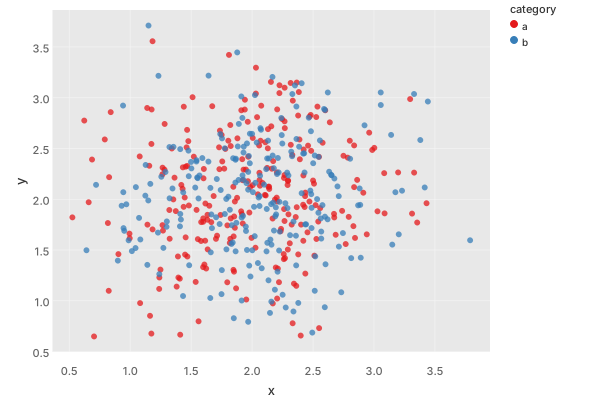
Or split the groups into separate panels with pj/facet:
(-> {:x (multivars)
     :y (multivars)
     :category (ab)}
    (pj/lay-point)
    (pj/facet :category))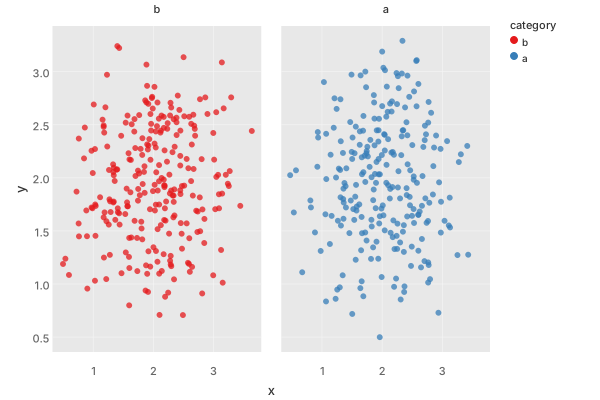
Plotje maps data to visual properties. You describe which columns map to which visual properties (position and color), and which layers (points, lines, bars) to draw.
Plotje embraces Clojure’s values
Simple
Simple here means not entangled. A plot is built from independent parts: data, mappings, layers, scales, and coordinates. Each part can be understood on its own, and changed without disturbing the others. There are no builder objects, no hidden state, and no global figure, only data and functions.
The API provides a small set of expressive functions to help build data structures that describe plots. A description is expanded through a pipeline: from a description, to an abstract representation, to a concrete format.
Value oriented
A plot is a value. Plotje calls the value at the heart of each plot a pose.
- pose
- the arrangement you settle into before the picture is taken.
A pose is a plain Clojure map with the data under :data, the column mapping under :mapping, and the chart-type layers under :layers. (See the Plotje chapter on poses.) You can print it, store it, and pass it around:
(def base
  (pj/pose {:x [1 2 3 4 5]
            :y [1 2 8 2 1]}
:x :y))^:kind/pprint
base{:mapping {:x :x, :y :y}, :layers [], :data _unnamed [5 2]:
| :x | :y |
|---:|---:|
| 1 | 1 |
| 2 | 2 |
| 3 | 8 |
| 4 | 2 |
| 5 | 1 |
}Functions take a pose and return a new one. One pose can be the starting point for several plots:
(pj/lay-bar base)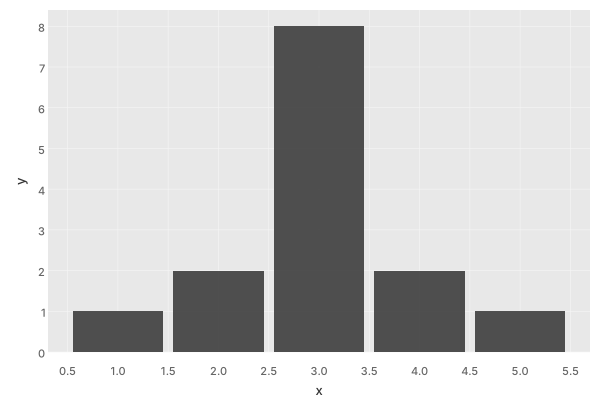
(-> base
    (pj/lay-line)
    (pj/lay-point)
    (pj/options {:title "Same data, different plot"}))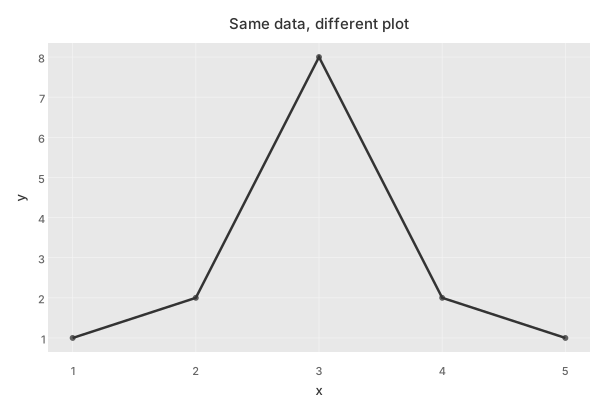
Most of the API functions take a pose, and return a new pose.
Flexible
Plotje accepts columns as a map of vectors:
(pj/lay-line {:x [1 2 3 4 5]
              :y [1 2 4 8 16]})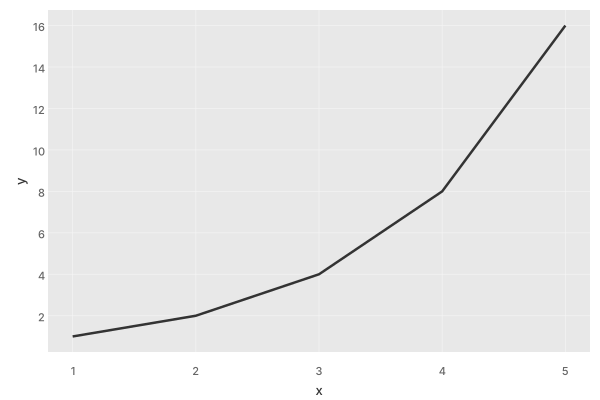
Or rows, as a vector of maps:
(-> [{:x 1 :y 1}
     {:x 2 :y 2}
     {:x 3 :y 4}
     {:x 4 :y 8}
     {:x 5 :y 16}]
    (pj/lay-line :x :y))
Or a Tablecloth dataset. Tablecloth provides many convenient and efficient data transformations.
(-> {:x [1 2 3 4 5]
     :y [1 2 4 8 16]}
    (tc/dataset)
    (tc/add-column :z (fn [ds] (map #(* 2 %) (ds :y))))
    (pj/lay-line :x [:y :z]))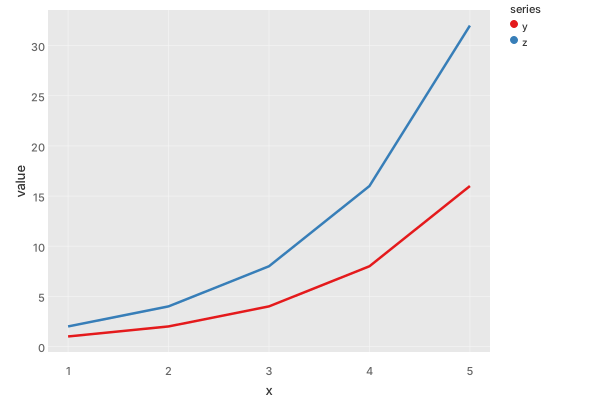
Tablecloth can also read a dataset from a file or URL. It is a convenient way to consume CSV files and Excel spreadsheets.
Wieldy
Plotje can produce several concrete forms of a plot:
- A static image (SVG or PNG) with
pj/save. - Hiccup to embed in an HTML page with
pj/plot. - A Membrane component to be part of a Java UI with
pj/membrane. - Clay detects and renders plots when making HTML, Markdown, and PDF.
Saving to a file is a good default if you are just starting out.
Save a plot as SVG:
(require '[babashka.fs :as fs])(-> {:x [1 2 3 4 5]
:y [1 2 4 8 16]}
(pj/lay-line)
(pj/save "temp/example.svg")
(fs/exists?))trueOr if you prefer PNG:
(-> {:x [1 2 3 4 5]
     :y [1 2 4 8 16]}
    (pj/lay-line)
    (pj/save "temp/example.png")
(fs/exists?))trueOr get the plot as Hiccup, which you can extend conveniently. Here we add a custom message to our plot:
(-> (pj/lay-line {:x [1 2 3 4]
                  :y [1 3 3 7]})
    (pj/plot)
    (into [[:ellipse {:cx 300 :cy 110 :rx 130 :ry 40
                      :fill "none" :stroke "green" :stroke-width 3}]
           [:text {:x 215 :y 120
                   :font-size 32
                   :fill "blue"}
            "Plotje rules!"]]))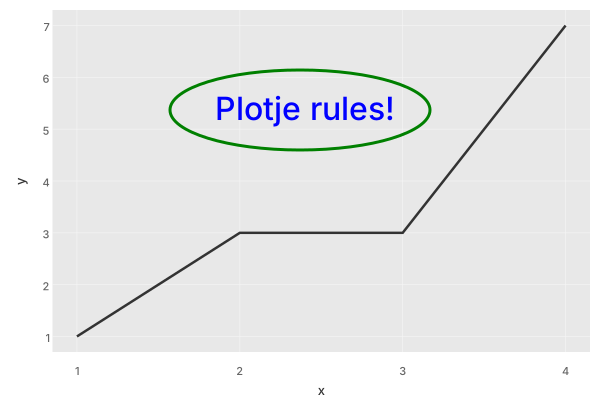
Or open the plot in a Java UI window with Membrane’s Java2D backend:
(require '[membrane.java2d :as java2d])

(-> {:x (repeatedly 100 #(rand-int 100))}
    (pj/membrane)
    (constantly)
    (java2d/run))
We make plots because we are building a report, a web page, a dashboard, an application. And also when we just wish to understand something better. Plotje is a direct path from your data to a chart that can be put wherever it needs to go.
Composable
The construction functions compose nicely, and the data itself can also be a composite. A pose is a tree that can contain other poses. The root holds data and mappings, and the poses inside inherit what they don’t override. Composed plots can be overlaid or tiled.
(-> (pj/arrange [(pj/pose {:x [1 2 3 4 5]
                           :y [1 2 4 8 16]})
                 (pj/pose {:x [1 2 3 4 5]
                           :y [16 8 4 2 1]})])
    (pj/lay-line)
    (pj/lay-point))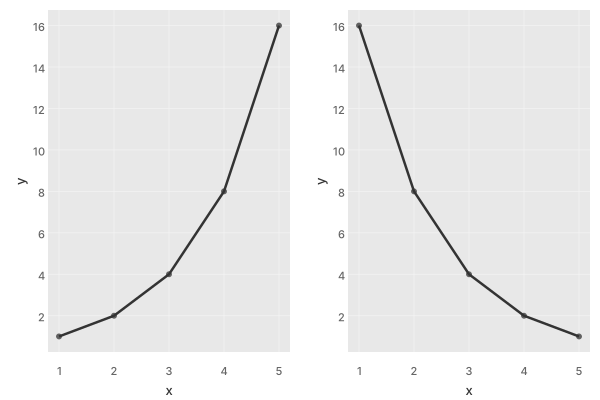
The line and point layers were applied to the root, while different data was placed in arranged leaves.
Poses are composable.
Expressive
Plotje expressions are concise, yet powerful enough for a wide range of plots. You say what the data means, and Plotje takes care of drawing it.
Here, in a few lines: bill length against body mass for each penguin, colored by species, with a smooth trend line per species, and a panel for each sex.
(require '[scicloj.metamorph.ml.rdatasets :as rdatasets])(-> (rdatasets/palmerpenguins-penguins)
(tc/drop-missing)
(pj/lay-point :bill-length-mm :body-mass-g {:color :species})
(pj/lay-smooth)
(pj/facet :sex))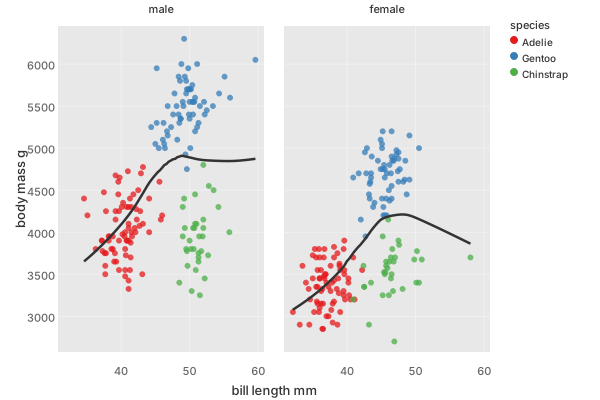
Isn’t that nice? Points, a smooth line, color, and panels: each is one small step. Change or remove any of them and the rest still works.
Learn more
This was only a little peek into Plotje. The Plotje documentation details many more features and capabilities. To see Plotje used in context, I hope you will read my Unbounded series, which contains the code for constructing economic charts from publicly available data.
The Plotje API is stabilizing, so now is a good time to try it and shape it. Questions, ideas, and bug reports are welcome. Most discussion happens at Clojurians Zulip: #plotje.
Plotje is excellent for simple visualizations, and capable of sophisticated ones for data science. Plotje is part of Noj, the data science toolkit for Clojure.
Happy plotting!
