Introducing Plotje: Composable Plotting
datavis
Plotje is a plotting library for Clojure, in the grammar-of-graphics tradition. You describe a plot by saying which column of your data becomes which visual property, and which drawing recipes are used. The description is a Clojure map. Plotje turns it into drawing primitives with Membrane, and Membrane renders those primitives to a target of your choosing: SVG markup by default, or a raster image that Java2D draws in the JVM.
This post is a tour. It starts with six rows typed out by hand and works up to the Dewey dataset, Adrian Smith’s weekly index of Clojure repositories on GitHub.
Plotje is alpha, and getting close to beta. That makes this a good moment to ask for help: the core vocabulary is settled, the edges still move, and anything that turns out to be wrong is cheapest to change before it stabilizes. Please try to break it, and tell us what you find.
Thanks
Plotje grew out of the Scicloj community, and specifically out of the Real-World Data dev group, which Timothy Pratley reinitiated and which meets weekly. Most of the design questions in this post were argued out there or in the #plotje stream on the Clojurians Zulip.
Particular thanks to Adrian Smith, whose Membrane does all the drawing here and whose Dewey dataset is the subject of every plot below.
To Timothy Pratley, who has drafted explorations and conceptualizations at several stages of the design, and who has filed a good share of the reports behind recent releases.
To generateme, for Tablecloth, Fastmath, Clojure2D and Wadogo – Plotje depends on all four – and for the earlier research around Cljplot.
To Chris Nuernberger and Harold Hausman, for tech.ml.dataset and dtype-next – the dataset infrastructure underneath Tablecloth, and so underneath every plot here.
To Carsten Behring, who has raised many of the questions and bug reports that shaped recent releases; and to Cvetomir Dimov, Kira Howe, Jon Anthony, respatialized, Bruce Durling and Teodor Heggelund for years of conversation about what plotting in Clojure should feel like.
And to Clojure Civitas, which calls itself a shared scratch space for publishing Clojure ideas without the overhead of setting up a blog: start with code, make it work, then tell the story. Much of Plotje’s design was worked out there in public, before the library existed:
Implementing the Algebra of Graphics in Clojure (December 2025), which called itself a draft for a future library API.
Representing Graphics as a Tree of Bindings and Plotting Datoms: Queries as Visual Mappings (January 2026), by Timothy Pratley.
Building a SPLOM using geom.viz (January 2026), building by hand what a plotting library would have to provide.
Visual data summaries (January 2026), also by Timothy Pratley.
Composable Plotting in Clojure (March 2026), the prototype Plotje grew out of.
This post is written the same way: a Clay notebook, where the code that made each picture is the code you read.
The libraries this post uses:
(ns data-visualization.introducing-plotje-composable-plotting
  (:require
   ;; Clojure -- reading a gzipped EDN file
   [clojure.edn]
   [clojure.java.io :as io]
   ;; Tablecloth -- dataset and column manipulation
   [tablecloth.api :as tc]
   [tablecloth.column.api :as tcc]
   ;; dtype-next -- vectorized column operations
   [tech.v3.datatype.datetime :as dtype-dt]
   ;; Kindly -- notebook annotation standard
   [scicloj.kindly.v4.kind :as kind]
   ;; Plotje -- composable plotting
   [scicloj.plotje.api :as pj]))
Starting small
Before any real data, the smallest useful thing: six Clojure libraries and how they are doing on GitHub, written as a plain vector of maps.
(def a-few-libraries
  [{:library "re-frame"  :stars 5541 :forks 711 :license "MIT"}
   {:library "reagent"   :stars 4884 :forks 411 :license "MIT"}
   {:library "babashka"  :stars 4586 :forks 274 :license "EPL-1.0"}
   {:library "ring"      :stars 3880 :forks 525 :license "MIT"}
   {:library "hiccup"    :stars 2854 :forks 177 :license "EPL-1.0"}
   {:library "clj-kondo" :stars 1848 :forks 305 :license "EPL-1.0"}])
That vector is the whole input, and it goes straight to a layer function:
(-> a-few-libraries
(pj/lay-bar :library :stars))A map of column vectors would have done as well, and so would a vector of row vectors. Plotje reads whichever shape the data is already in and passes it through tc/dataset on the way, so everything downstream works on a Tablecloth dataset. Datasets, and why they matter comes back to when that is worth caring about.
The same six rows again, as points rather than bars, colored by license and labelled by name:
(-> a-few-libraries
    (pj/pose :stars :forks {:color :license})
    pj/lay-point
(pj/lay-label {:text :library :nudge-y 18}))Warning: lay-label: :nudge-y was renamed to :dy, and is read as :dy for now. Write :dy.
The axes took their ranges and their titles from the columns without being asked, and the color mapping produced both a palette and a legend. You say which column means what, and the rest is filled in.
The form above is also the first sight of pj/pose. Plotje calls the description of a plot a pose, and here it carries the mapping that both layers share. A pose is a value, below, takes one apart; until then, a pose is simply the value these pipelines pass along.
Challenges addressed by Plotje
Plotje’s design was argued out in public before the library existed, in a series of Clojure Civitas posts. Those posts name the problems it is meant to solve.
Sensible defaults, systematic inference. Visual data summaries works through classifying a column – quantitative, temporal, categorical – so that a picture can be chosen from the column’s role. In Plotje the column types decide: one numerical column becomes a histogram, two a scatter, a categorical column against a numerical one a boxplot. The axis ranges and titles, the palette and the legend come from the columns too.
Easy debugging. Implementing the Algebra of Graphics in Clojure names Tableplot’s intermediate representation – Hanami templates – as flexible but open-ended, with error messages that sometimes point at template internals rather than at your code. A pose is a map,
assocworks on it, and each of the five stages below is a function you can stop at and print.A unified API for several rendering targets. In the existing libraries each API is tied to one target, so reaching a limit of that target means learning a different API. Plotje describes the plot once and renders it through Membrane: SVG markup, a Java2D
BufferedImage, a file, or a component inside a desktop user interface. New targets are meant to attach the same way: the step to a finished plot, from the plan or from the Membrane tree – the two intermediate representations described below – dispatches on a format keyword, which is how SVG and theBufferedImageare attached today. The Membrane tree is Membrane’s own representation and is well-established; the plan is Plotje’s, and its specification has still to settle.Interactivity without a JavaScript library.
:tooltipand:brushride on the SVG itself. The values are attributes on the shapes, and Plotje embeds the small script that reads them.Multi-panel layout that follows from the specification. Building a SPLOM using geom.viz assembles a scatterplot matrix by hand over twelve steps – grid offsets, scale sharing, color assignment, detecting the diagonal so that it draws a histogram rather than a scatter – and says outright that doing it by hand is how you learn what a library has to provide.
pj/facet,pj/arrangeandpj/crosstake that work over.Extensibility. A layer type consists of a mark, a stat and a position, and is registered under a keyword:
scicloj.plotje.layer-type/register!adds one,pj/layplaces it on a pose, and a one-linedefngives it alay-*function like the built-in ones. The Waterfall Extension chapter builds one end to end.
Running this yourself
The two plots above were evaluated, not pasted in as images, and the same goes for every plot below. It is worth saying early how that is done, because it is the part of the workflow you will spend your time in.
Clay, interactively
The recommended way is Clay, a notebook tool that watches your namespace and shows the value of whatever you evaluate in a browser window beside your editor. You keep your normal REPL workflow – evaluate a form, look at the picture, change the form – and Clay renders datasets as tables, plots as pictures, and comment lines as prose. This post is a Clay notebook: every plot in it came out of evaluating the form printed above it.
Nothing in Plotje requires Clay. A pose carries a Kindly annotation – Kindly is the standard that Clay and the other Clojure notebook tools share – so the same namespace works in whichever of them you prefer.
Saving a plot to a file
Take the bar chart from above and give it a name:
(def libraries-chart
  (-> a-few-libraries
      (pj/lay-bar :library :stars)))
pj/save writes it to a file, and the extension picks the format:
(pj/save libraries-chart "/tmp/libraries.svg")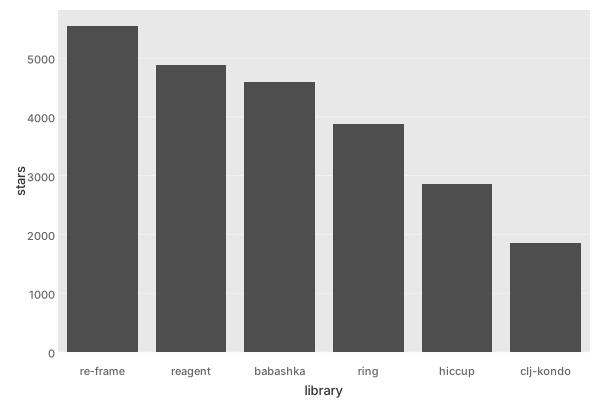
(pj/save libraries-chart "/tmp/libraries.png")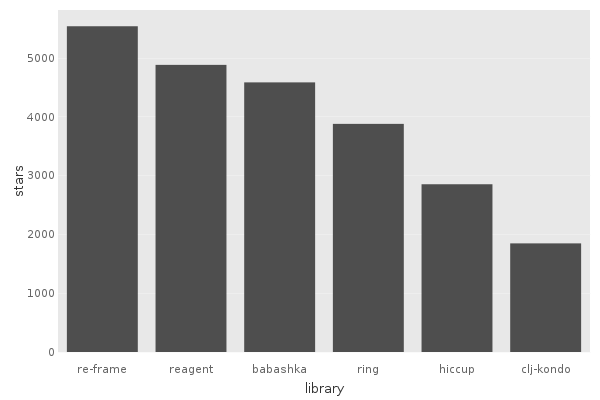
Each call returns the file it wrote, carrying a Kindly annotation, which is why the saved chart appears here as well.
If you want the value rather than the file, pj/plot hands it back. The default is SVG as Hiccup, which is to say a vector:
(-> libraries-chart
    pj/plot
kind/pprint)[:svg
{:xmlns "http://www.w3.org/2000/svg",
:width 600,
:height 400,
:viewBox "0 0 600 400",
:role "img",
:class "plotje-plot",
:font-family
"system-ui, -apple-system, BlinkMacSystemFont, 'Segoe UI', sans-serif"}
[:g
[:g
{:transform "translate(12.00,181.00)"}
[:g
{:transform "rotate(-90.00)"}
[:g
[:text
{:fill "rgb(51,51,51)",
:fill-opacity 1.0,
:font-size 13,
:dominant-baseline "hanging",
:text-anchor "middle"}
"stars"]]]]
[:g
{:transform "translate(324.00,382.00)"}
[:g
[:text
{:fill "rgb(51,51,51)",
:fill-opacity 1.0,
:font-size 13,
:dominant-baseline "hanging",
:text-anchor "middle"}
"library"]]]
[:g
{:transform "translate(58.00,10.00)"}
[:g
[:g
[:rect
{:fill "rgb(232,232,232)",
:fill-opacity 1.0,
:stroke "none",
:x 0,
:y 0,
:width 532.0,
:height 342.0}]]]]
[:g
{:transform "translate(48.00,0.00)"}
[:g
[:g
[:g
[:g
[:polyline
{:fill "none",
:stroke "rgb(245,245,245)",
:stroke-opacity 1.0,
:stroke-width 0.6,
:points "10.00,352.00 542.00,352.00"}]]]]
[:g
[:g
[:g
[:polyline
{:fill "none",
:stroke "rgb(245,245,245)",
:stroke-opacity 1.0,
:stroke-width 0.6,
:points "10.00,293.22 542.00,293.22"}]]]]
[:g
[:g
[:g
[:polyline
{:fill "none",
:stroke "rgb(245,245,245)",
:stroke-opacity 1.0,
:stroke-width 0.6,
:points "10.00,234.43 542.00,234.43"}]]]]
[:g
[:g
[:g
[:polyline
{:fill "none",
:stroke "rgb(245,245,245)",
:stroke-opacity 1.0,
:stroke-width 0.6,
:points "10.00,175.65 542.00,175.65"}]]]]
[:g
[:g
[:g
[:polyline
{:fill "none",
:stroke "rgb(245,245,245)",
:stroke-opacity 1.0,
:stroke-width 0.6,
:points "10.00,116.87 542.00,116.87"}]]]]
[:g
[:g
[:g
[:polyline
{:fill "none",
:stroke "rgb(245,245,245)",
:stroke-opacity 1.0,
:stroke-width 0.6,
:points "10.00,58.09 542.00,58.09"}]]]]
[:g
{}
[:clipPath
{:id "plotje-clip-spjdxq"}
[:rect
{:x "10.00", :y "10.00", :width "532.00", :height "342.00"}]]
[:g
{:clip-path "url(#plotje-clip-spjdxq)"}
[:g
[:g
[:g
[:polygon
{:fill "rgb(51,51,51)",
:fill-opacity 0.85,
:stroke "none",
:points
"18.87,352.00 89.80,352.00 89.80,26.29 18.87,26.29 18.87,352.00",
:shape-rendering "crispEdges"}]]]
[:g
[:g
[:polygon
{:fill "rgb(51,51,51)",
:fill-opacity 0.85,
:stroke "none",
:points
"107.53,352.00 178.47,352.00 178.47,64.91 107.53,64.91 107.53,352.00",
:shape-rendering "crispEdges"}]]]
[:g
[:g
[:polygon
{:fill "rgb(51,51,51)",
:fill-opacity 0.85,
:stroke "none",
:points
"196.20,352.00 267.13,352.00 267.13,82.42 196.20,82.42 196.20,352.00",
:shape-rendering "crispEdges"}]]]
[:g
[:g
[:polygon
{:fill "rgb(51,51,51)",
:fill-opacity 0.85,
:stroke "none",
:points
"284.87,352.00 355.80,352.00 355.80,123.92 284.87,123.92 284.87,352.00",
:shape-rendering "crispEdges"}]]]
[:g
[:g
[:polygon
{:fill "rgb(51,51,51)",
:fill-opacity 0.85,
:stroke "none",
:points
"373.53,352.00 444.47,352.00 444.47,184.23 373.53,184.23 373.53,352.00",
:shape-rendering "crispEdges"}]]]
[:g
[:g
[:polygon
{:fill "rgb(51,51,51)",
:fill-opacity 0.85,
:stroke "none",
:points
"462.20,352.00 533.13,352.00 533.13,243.37 462.20,243.37 462.20,352.00",
:shape-rendering "crispEdges"}]]]]]]
[:g
{:transform "translate(54.33,364.00)"}
[:g
[:text
{:fill "rgb(102,102,102)",
:fill-opacity 1.0,
:font-size 11,
:dominant-baseline "hanging",
:text-anchor "middle"}
"re-frame"]]]
[:g
{:transform "translate(143.00,364.00)"}
[:g
[:text
{:fill "rgb(102,102,102)",
:fill-opacity 1.0,
:font-size 11,
:dominant-baseline "hanging",
:text-anchor "middle"}
"reagent"]]]
[:g
{:transform "translate(231.67,364.00)"}
[:g
[:text
{:fill "rgb(102,102,102)",
:fill-opacity 1.0,
:font-size 11,
:dominant-baseline "hanging",
:text-anchor "middle"}
"babashka"]]]
[:g
{:transform "translate(320.33,364.00)"}
[:g
[:text
{:fill "rgb(102,102,102)",
:fill-opacity 1.0,
:font-size 11,
:dominant-baseline "hanging",
:text-anchor "middle"}
"ring"]]]
[:g
{:transform "translate(409.00,364.00)"}
[:g
[:text
{:fill "rgb(102,102,102)",
:fill-opacity 1.0,
:font-size 11,
:dominant-baseline "hanging",
:text-anchor "middle"}
"hiccup"]]]
[:g
{:transform "translate(497.67,364.00)"}
[:g
[:text
{:fill "rgb(102,102,102)",
:fill-opacity 1.0,
:font-size 11,
:dominant-baseline "hanging",
:text-anchor "middle"}
"clj-kondo"]]]
[:g
{:transform "translate(7.00,346.50)"}
[:g
[:text
{:fill "rgb(102,102,102)",
:fill-opacity 1.0,
:font-size 11,
:dominant-baseline "hanging",
:text-anchor "end"}
"0"]]]
[:g
{:transform "translate(7.00,287.72)"}
[:g
[:text
{:fill "rgb(102,102,102)",
:fill-opacity 1.0,
:font-size 11,
:dominant-baseline "hanging",
:text-anchor "end"}
"1000"]]]
[:g
{:transform "translate(7.00,228.93)"}
[:g
[:text
{:fill "rgb(102,102,102)",
:fill-opacity 1.0,
:font-size 11,
:dominant-baseline "hanging",
:text-anchor "end"}
"2000"]]]
[:g
{:transform "translate(7.00,170.15)"}
[:g
[:text
{:fill "rgb(102,102,102)",
:fill-opacity 1.0,
:font-size 11,
:dominant-baseline "hanging",
:text-anchor "end"}
"3000"]]]
[:g
{:transform "translate(7.00,111.37)"}
[:g
[:text
{:fill "rgb(102,102,102)",
:fill-opacity 1.0,
:font-size 11,
:dominant-baseline "hanging",
:text-anchor "end"}
"4000"]]]
[:g
{:transform "translate(7.00,52.59)"}
[:g
[:text
{:fill "rgb(102,102,102)",
:fill-opacity 1.0,
:font-size 11,
:dominant-baseline "hanging",
:text-anchor "end"}
"5000"]]]]]]]With {:format :bufimg}, pj/plot hands back a java.awt.image.BufferedImage instead, to put in a Swing window or hand to another library:
(pj/plot libraries-chart {:format :bufimg})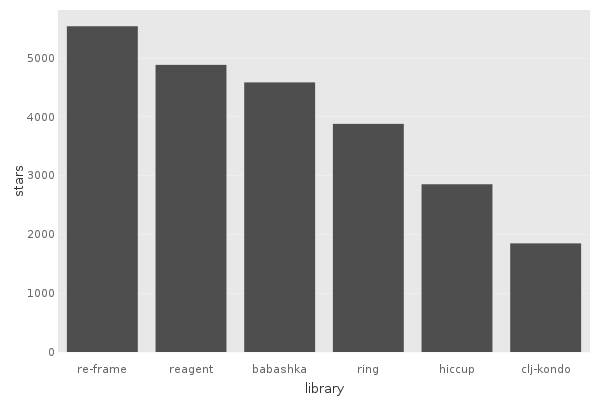
What workflows might look like later
Adrian Smith is building Easel, an editor and workbench written in Clojure on top of Membrane. A Plotje plot can be represented as a Membrane component (more on that below), so it can go into a Membrane user interface as one element among others, with no SVG string and no browser in between. Adrian has shown a few promising demos of Easel and Plotje together in Real-World Data meetings.
It is early days. Rendering the same plot into a notebook page today and into a live desktop tool tomorrow is where this is heading.
The data
Dewey crawls GitHub for Clojure projects and publishes the result as a weekly release. One of the files is every repository it knows about, as gzipped EDN. This is Adrian’s own snippet for reading it:
(defn read-edn-gz [in]
  (with-open [in (io/input-stream in)
              gz (java.util.zip.GZIPInputStream/new in)
              rdr (io/reader gz)
              pbr (java.io.PushbackReader. rdr)]
    (clojure.edn/read pbr)))
The two timestamps arrive as strings, and :parser-fn is where a Tablecloth dataset is told what they really are. Doing it at read time rather than later matters for a reason the rest of the post keeps coming back to: a column’s type decides how its values are plotted.
(defonce all-repos
  (tc/dataset
   (read-edn-gz
    "https://github.com/phronmophobic/dewey/releases/download/2026-08-16/all-repos.edn.gz")
   {:parser-fn {:created_at [:local-date-time "yyyy-MM-dd'T'HH:mm:ss'Z'"]
                :pushed_at  [:local-date-time "yyyy-MM-dd'T'HH:mm:ss'Z'"]}}))
That is a Tablecloth dataset now. tc/shape gives its row and column counts:
(tc/shape all-repos)[15217 83]The columns are more of GitHub’s API than this post needs, and one, the license, arrives as a nested map. So the next step is an ordinary Tablecloth pipeline that keeps the ones this post uses, gives them shorter names, flattens the license to its identifier, and adds a derived column – the number of days between the day a repository was created and the day it was last pushed to, which is as close as this data gets to how long the project was worked on:
(defonce repos
  (-> all-repos
      (tc/select-columns [:full_name :description :stargazers_count :forks_count
                          :open_issues_count :size :topics :license :archived
                          :created_at :pushed_at])
      (tc/rename-columns {:stargazers_count  :stars
                          :forks_count       :forks
                          :open_issues_count :issues
                          :created_at        :created
                          :pushed_at         :pushed})
      (tc/map-columns :license [:license] (fn [m] (or (:spdx_id m) "none")))
      (tc/add-column :life-days
(fn [ds] (dtype-dt/between (ds :created) (ds :pushed) :days)))))repos_unnamed [15217 12]:
| :full_name | :description | :stars | :forks | :issues | :size | :topics | :license | :archived | :created | :pushed | :life-days |
|---|---|---|---|---|---|---|---|---|---|---|---|
| tonsky/FiraCode | Free monospaced font with programming ligatures | 81922 | 3186 | 428 | 90653 | [font ligatures programming-ligatures] | OFL-1.1 | false | 2014-11-11T19:32:38 | 2026-07-28T17:02:16 | 4276 |
| penpot/penpot | Penpot: The open-source design platform for Product teams that need scalable collaboration. | 58654 | 3960 | 804 | 397669 | [clojure clojurescript design prototyping ui ux-design ux-experience] | MPL-2.0 | false | 2015-12-29T22:09:07 | 2026-08-14T18:16:22 | 3880 |
| metabase/metabase | The easy-to-use open source Business Intelligence and Embedded Analytics tool that lets everyone work with data :bar_chart: | 48782 | 6752 | 4327 | 2175565 | [analytics | NOASSERTION | false | 2015-02-02T19:25:47 | 2026-08-16T06:15:01 | 4212 |
| bi | |||||||||||
| business-intelligence | |||||||||||
| businessintelligence | |||||||||||
| clojure | |||||||||||
| dashboard | |||||||||||
| data | |||||||||||
| data-analysis | |||||||||||
| data-visualization | |||||||||||
| database | |||||||||||
| metabase | |||||||||||
| mysql | |||||||||||
| postgres | |||||||||||
| postgresql | |||||||||||
| reporting | |||||||||||
| slack | |||||||||||
| sql-editor | |||||||||||
| visualization] | |||||||||||
| logseq/logseq | A privacy-first, open-source platform for knowledge management and collaboration. Download link: http://github.com/logseq/logseq/releases. roadmap: https://logseq.io/p/NX4mc_ggEV | 44468 | 2770 | 961 | 179586 | [clojure | AGPL-3.0 | false | 2020-05-23T00:06:06 | 2026-08-16T06:36:45 | 2276 |
| clojurescript | |||||||||||
| git | |||||||||||
| graph | |||||||||||
| knowledge-base | |||||||||||
| knowledge-graph | |||||||||||
| local-first | |||||||||||
| markdown | |||||||||||
| note-taking | |||||||||||
| org-mode | |||||||||||
| pkm] | |||||||||||
| LightTable/LightTable | The Light Table IDE ⛺ | 11689 | 912 | 181 | 19648 | [clojure clojure-development clojurescript editor ide lighttable] | MIT | true | 2012-06-27T22:32:43 | 2022-06-17T00:20:21 | 3641 |
| clojure/clojurescript | Clojure to JS compiler | 9389 | 782 | 7 | 18788 | [] | EPL-1.0 | false | 2011-07-20T23:29:13 | 2026-08-10T01:25:46 | 5499 |
| jepsen-io/jepsen | A framework for distributed systems verification, with fault injection | 7471 | 754 | 66 | 47977 | [] | none | false | 2013-04-14T19:20:27 | 2026-08-14T18:37:49 | 4869 |
| technomancy/leiningen | Moved to Codeberg; this is a temporary convenience mirror | 7297 | 1571 | 94 | 7596 | [] | NOASSERTION | false | 2009-11-01T05:50:07 | 2026-06-08T15:12:19 | 6063 |
| omcljs/om | ClojureScript interface to Facebook’s React | 6623 | 352 | 80 | 2181 | [] | none | false | 2013-12-11T18:18:11 | 2020-08-17T12:30:25 | 2440 |
| athensresearch/athens | Athens is no longer maintainted. Athens was an open-source, collaborative knowledge graph, backed by YC W21 | 6301 | 396 | 316 | 78287 | [hacktoberfest | NOASSERTION | false | 2020-03-31T01:29:41 | 2023-02-03T12:32:15 | 1039 |
| knowledge-base | |||||||||||
| knowledge-graph | |||||||||||
| knowledge-management | |||||||||||
| memex | |||||||||||
| notetaking | |||||||||||
| tools-for-thought] | |||||||||||
| … | … | … | … | … | … | … | … | … | … | … | … |
| Dale-Harrison/spouse-reminder | Server side code for spouse-reminder app | 1 | 0 | 0 | 1160 | [] | none | false | 2012-01-23T22:41:43 | 2012-03-20T21:59:01 | 56 |
| pgdad/clj-zoo-watcher | 1 | 0 | 0 | 132 | [] | none | false | 2012-03-10T00:59:59 | 2012-07-20T15:37:27 | 132 | |
| ryankohl/movies | A look at movie data | 1 | 0 | 0 | 2312 | [] | none | false | 2012-03-26T02:13:46 | 2012-05-14T11:49:08 | 49 |
| mjhogue/epicerie | 1 | 0 | 0 | 164 | [] | none | false | 2012-03-29T01:42:07 | 2012-04-01T18:37:34 | 3 | |
| longfin/warklet | Share link to twitter and facebook via bookmark. | 1 | 0 | 0 | 248 | [] | none | false | 2012-07-08T14:31:13 | 2012-08-07T17:41:55 | 30 |
| julienfantin/sndcld-clj | 1 | 0 | 0 | 112 | [] | none | false | 2012-06-23T21:28:25 | 2012-07-07T20:00:25 | 13 | |
| mikethayes/taken | taken | 1 | 0 | 0 | 104 | [] | none | false | 2012-06-26T17:25 | 2012-06-27T11:32:23 | 0 |
| watersofoblivion/pairing | 1 | 0 | 0 | 96 | [] | none | false | 2012-07-30T19:08:33 | 2012-07-30T19:08:42 | 0 | |
| enterlab/easy-xml | Small parsing library wrapping clojure.xml. Makes it a breeze to extract elements, texts and attributes from XML sources (URLs or pre-parsed with clojure.xml/parse). | 1 | 0 | 0 | 7 | [clojure xml] | EPL-1.0 | false | 2013-09-20T13:11:38 | 2019-02-18T12:05:16 | 1976 |
| relevance/fluxion | Asynchronous metric collection, aggregation, and delivery | 1 | 2 | 0 | 124 | [] | none | false | 2013-12-20T16:24 | 2014-01-31T21:17:53 | 42 |
| tailrecursion/warp | Exception handling control flow for Clojure. | 1 | 1 | 0 | 136 | [] | EPL-1.0 | false | 2014-01-07T19:56:22 | 2014-01-08T03:01:22 | 0 |
A few plots
When was Clojure code written?
Count the repositories by the month they were created:
(def by-month
  (-> repos
      (tc/map-columns :month [:created]
                      (fn [^java.time.LocalDateTime t]
                        (.withDayOfMonth (.toLocalDate t) 1)))
      (tc/group-by [:month])
      (tc/aggregate {:repos tc/row-count})
(tc/order-by :month)))by-month_unnamed [220 2]:
| :month | :repos |
|---|---|
| 2008-04-01 | 1 |
| 2008-05-01 | 1 |
| 2008-06-01 | 1 |
| 2008-07-01 | 1 |
| 2008-09-01 | 2 |
| 2008-10-01 | 2 |
| 2008-11-01 | 9 |
| 2008-12-01 | 15 |
| 2009-01-01 | 14 |
| 2009-02-01 | 13 |
| … | … |
| 2025-10-01 | 26 |
| 2025-11-01 | 22 |
| 2025-12-01 | 30 |
| 2026-01-01 | 40 |
| 2026-02-01 | 38 |
| 2026-03-01 | 47 |
| 2026-04-01 | 39 |
| 2026-05-01 | 33 |
| 2026-06-01 | 24 |
| 2026-07-01 | 19 |
| 2026-08-01 | 7 |
Drawn as a line:
(-> by-month
    (pj/lay-line :month :repos)
(pj/options {:title "Clojure repositories created on GitHub, by month"}))The x axis is a calendar axis, ticked every two years rather than at each of the two hundred and twenty months in the data. Nobody asked for the two-year spacing. It follows from the type of the :month column:
(tcc/typeof (by-month :month)):packed-local-dateDatasets, and why they matter comes back to what else a column’s type decides.
The shape of the line is a story about the ecosystem: a fast climb from 2009, a peak in the middle of the 2010s, a long decline since. The last point is a partial month – this snapshot was taken in the middle of August 2026.
Stars and forks, with a legend and a tooltip
Take the repositories with at least five hundred stars. The ones with no forks are left out too, because both axes below get a log scale and a log axis has no reading for zero:
(def popular
  (-> repos
      (tc/select-rows (fn [row] (and (>= (:stars row) 500)
(pos? (:forks row)))))))popular_unnamed [289 12]:
| :full_name | :description | :stars | :forks | :issues | :size | :topics | :license | :archived | :created | :pushed | :life-days |
|---|---|---|---|---|---|---|---|---|---|---|---|
| tonsky/FiraCode | Free monospaced font with programming ligatures | 81922 | 3186 | 428 | 90653 | [font ligatures programming-ligatures] | OFL-1.1 | false | 2014-11-11T19:32:38 | 2026-07-28T17:02:16 | 4276 |
| penpot/penpot | Penpot: The open-source design platform for Product teams that need scalable collaboration. | 58654 | 3960 | 804 | 397669 | [clojure clojurescript design prototyping ui ux-design ux-experience] | MPL-2.0 | false | 2015-12-29T22:09:07 | 2026-08-14T18:16:22 | 3880 |
| metabase/metabase | The easy-to-use open source Business Intelligence and Embedded Analytics tool that lets everyone work with data :bar_chart: | 48782 | 6752 | 4327 | 2175565 | [analytics | NOASSERTION | false | 2015-02-02T19:25:47 | 2026-08-16T06:15:01 | 4212 |
| bi | |||||||||||
| business-intelligence | |||||||||||
| businessintelligence | |||||||||||
| clojure | |||||||||||
| dashboard | |||||||||||
| data | |||||||||||
| data-analysis | |||||||||||
| data-visualization | |||||||||||
| database | |||||||||||
| metabase | |||||||||||
| mysql | |||||||||||
| postgres | |||||||||||
| postgresql | |||||||||||
| reporting | |||||||||||
| slack | |||||||||||
| sql-editor | |||||||||||
| visualization] | |||||||||||
| logseq/logseq | A privacy-first, open-source platform for knowledge management and collaboration. Download link: http://github.com/logseq/logseq/releases. roadmap: https://logseq.io/p/NX4mc_ggEV | 44468 | 2770 | 961 | 179586 | [clojure | AGPL-3.0 | false | 2020-05-23T00:06:06 | 2026-08-16T06:36:45 | 2276 |
| clojurescript | |||||||||||
| git | |||||||||||
| graph | |||||||||||
| knowledge-base | |||||||||||
| knowledge-graph | |||||||||||
| local-first | |||||||||||
| markdown | |||||||||||
| note-taking | |||||||||||
| org-mode | |||||||||||
| pkm] | |||||||||||
| LightTable/LightTable | The Light Table IDE ⛺ | 11689 | 912 | 181 | 19648 | [clojure clojure-development clojurescript editor ide lighttable] | MIT | true | 2012-06-27T22:32:43 | 2022-06-17T00:20:21 | 3641 |
| clojure/clojurescript | Clojure to JS compiler | 9389 | 782 | 7 | 18788 | [] | EPL-1.0 | false | 2011-07-20T23:29:13 | 2026-08-10T01:25:46 | 5499 |
| jepsen-io/jepsen | A framework for distributed systems verification, with fault injection | 7471 | 754 | 66 | 47977 | [] | none | false | 2013-04-14T19:20:27 | 2026-08-14T18:37:49 | 4869 |
| technomancy/leiningen | Moved to Codeberg; this is a temporary convenience mirror | 7297 | 1571 | 94 | 7596 | [] | NOASSERTION | false | 2009-11-01T05:50:07 | 2026-06-08T15:12:19 | 6063 |
| omcljs/om | ClojureScript interface to Facebook’s React | 6623 | 352 | 80 | 2181 | [] | none | false | 2013-12-11T18:18:11 | 2020-08-17T12:30:25 | 2440 |
| athensresearch/athens | Athens is no longer maintainted. Athens was an open-source, collaborative knowledge graph, backed by YC W21 | 6301 | 396 | 316 | 78287 | [hacktoberfest | NOASSERTION | false | 2020-03-31T01:29:41 | 2023-02-03T12:32:15 | 1039 |
| knowledge-base | |||||||||||
| knowledge-graph | |||||||||||
| knowledge-management | |||||||||||
| memex | |||||||||||
| notetaking | |||||||||||
| tools-for-thought] | |||||||||||
| … | … | … | … | … | … | … | … | … | … | … | … |
| nathanmarz/storm-deploy | One click deploy for Storm clusters on AWS | 513 | 144 | 36 | 559 | [] | NOASSERTION | false | 2011-09-02T19:20:13 | 2015-07-21T18:09:23 | 1417 |
| hraberg/deuce | Deuce is (not yet) Emacs under Clojure | 511 | 14 | 0 | 16022 | [] | GPL-3.0 | true | 2012-04-14T10:01:27 | 2016-08-01T13:17:18 | 1570 |
| richhickey/clojure-contrib | NOTE - the contrib libraries have moved to individual repos under Clojure: | 510 | 79 | 3 | 3622 | [] | none | false | 2009-06-12T22:14:06 | 2024-01-22T21:26:29 | 5336 |
| technomancy/slamhound | Slamhound rips your namespace form apart and reconstructs it. | 510 | 37 | 18 | 472 | [] | NOASSERTION | true | 2011-04-25T16:57:46 | 2020-10-01T20:00:38 | 3447 |
| juxt/edge | A Clojure application foundation from JUXT | 510 | 60 | 38 | 2768 | [clojure clojurescript starter starter-kit] | MIT | false | 2015-12-10T07:31:11 | 2021-09-13T21:05:17 | 2104 |
| hoophq/sequence | Immutable, scalable, and easy to use ledger service. | 509 | 33 | 13 | 49 | [bookkeeping | Apache-2.0 | false | 2020-09-02T16:55:25 | 2026-07-21T18:20:54 | 2148 |
| double-entry-accounting | |||||||||||
| fintech | |||||||||||
| hash-chain | |||||||||||
| ledger | |||||||||||
| merkle-tree] | |||||||||||
| ClickHouse/metabase-clickhouse-driver | ClickHouse database driver for the Metabase business intelligence front-end | 509 | 98 | 30 | 616 | [analytics bi-tools business-intelligence clickhouse metabase] | Apache-2.0 | true | 2019-03-11T23:01:26 | 2025-06-13T00:54:21 | 2285 |
| cemerick/austin | The ClojureScript browser-REPL rebuilt stronger, faster, easier. | 507 | 28 | 19 | 453 | [] | none | false | 2013-08-02T14:08:14 | 2022-01-24T21:14:46 | 3097 |
| relevance/labrepl | 506 | 79 | 3 | 2222 | [] | none | false | 2010-01-14T09:11:28 | 2014-12-03T20:20:06 | 1784 | |
| killme2008/defun | A macro to define clojure functions with parameter pattern matching just like erlang or elixir. | 503 | 21 | 3 | 48 | [clojure clojure-functions defun pattern-matching] | EPL-1.0 | false | 2014-09-14T06:29:15 | 2023-10-20T16:42:02 | 3323 |
| weavejester/lein-ring | Ring plugin for Leiningen | 500 | 99 | 47 | 254 | [clojure leiningen ring war] | EPL-1.0 | false | 2010-12-07T21:33:17 | 2023-05-31T23:00:07 | 4558 |
The same columns as repos, fewer of the rows. Stars against forks, both counts being heavily skewed, so both axes on a log scale. The :color mapping separates archived repositories from live ones, and :tooltip at the end makes the picture interactive:
(-> popular
    (pj/lay-point :stars :forks {:color :archived :alpha 0.6})
    (pj/scale :x :log)
    (pj/scale :y :log)
    (pj/options {:tooltip true
:title "Stars and forks, repositories with 500+ stars"}))Hover a point and it names its values. The tooltip comes out of the SVG itself: the values ride on each shape as attributes, and Plotje embeds the small script that reads them. A brush, which lights the same rows across several panels, arrives later in the post where there are panels to link.
The legend was not asked for. A :color mapping onto a column of strings or booleans means “one color per distinct value, and a legend saying which”.
Stars and forks track each other closely enough over three orders of magnitude that the cloud reads as a band rather than a scatter.
Licenses over time
The license column is worth a picture of its own. Count repositories by license and creation year, for the four licenses that dominate:
(def licensed-by-year
  (-> repos
      (tc/select-rows (fn [row] (contains? #{"EPL-1.0" "EPL-2.0" "MIT" "Apache-2.0"}
                                           (:license row))))
      (tc/add-column :year (fn [ds] (dtype-dt/long-temporal-field :years (ds :created))))
      (tc/group-by [:license :year])
      (tc/aggregate {:repos tc/row-count})
(tc/order-by [:license :year])))licensed-by-year_unnamed [72 3]:
| :license | :year | :repos |
|---|---|---|
| Apache-2.0 | 2009 | 1 |
| Apache-2.0 | 2010 | 7 |
| Apache-2.0 | 2011 | 11 |
| Apache-2.0 | 2012 | 12 |
| Apache-2.0 | 2013 | 31 |
| Apache-2.0 | 2014 | 73 |
| Apache-2.0 | 2015 | 79 |
| Apache-2.0 | 2016 | 58 |
| Apache-2.0 | 2017 | 48 |
| Apache-2.0 | 2018 | 60 |
| … | … | … |
| MIT | 2016 | 234 |
| MIT | 2017 | 182 |
| MIT | 2018 | 184 |
| MIT | 2019 | 173 |
| MIT | 2020 | 194 |
| MIT | 2021 | 159 |
| MIT | 2022 | 157 |
| MIT | 2023 | 133 |
| MIT | 2024 | 91 |
| MIT | 2025 | 86 |
| MIT | 2026 | 89 |
Faceted by license:
(-> licensed-by-year
    (pj/lay-line :year :repos {:color :license})
(pj/facet :license))pj/facet splits one plot into a panel per value of a column, with the axes shared so that the panels can be read against each other. EPL-1.0 – Clojure’s own license – towers over the others in the early 2010s and then collapses; MIT rises more slowly and holds up better; Apache-2.0 stays modest throughout; EPL-2.0, published in 2017, shows up as a short spike around 2019. The years here are the years the repositories were created, not the years the licenses were chosen, which is why a handful of older repositories carry a license that did not exist when they started.
How long does a repository last?
:life-days is the gap between a repository’s first day and its last push:
(tcc/median (repos :life-days))350.0The middle Clojure repository on GitHub was last touched less than a year after it appeared.
Count, for each year, the share of that year’s repositories that were never pushed again after the first day, and the share never pushed again after the first week. tc/aggregate gives one column per share:
(def abandonment-wide
  (-> repos
      (tc/add-column :year (fn [ds] (dtype-dt/long-temporal-field :years (ds :created))))
      (tc/select-rows (fn [row] (<= 2009 (:year row) 2025)))
      (tc/group-by [:year])
      (tc/aggregate {:same-day   (fn [ds] (double (/ (count (filter (fn [d] (< d 1)) (ds :life-days)))
                                                     (tc/row-count ds))))
                     :first-week (fn [ds] (double (/ (count (filter (fn [d] (< d 7)) (ds :life-days)))
(tc/row-count ds))))})))abandonment-wide_unnamed [17 3]:
| :year | :same-day | :first-week |
|---|---|---|
| 2014 | 0.11647140 | 0.18125431 |
| 2015 | 0.10784983 | 0.18293515 |
| 2020 | 0.10251046 | 0.17887029 |
| 2012 | 0.13344316 | 0.20675453 |
| 2011 | 0.13793103 | 0.21759810 |
| 2013 | 0.09286262 | 0.16807368 |
| 2009 | 0.08256881 | 0.15137615 |
| 2010 | 0.14629630 | 0.23148148 |
| 2019 | 0.10896130 | 0.15478615 |
| 2016 | 0.08958652 | 0.14318530 |
| 2017 | 0.09918107 | 0.16469518 |
| 2018 | 0.11195446 | 0.17457306 |
| 2021 | 0.11258278 | 0.17880795 |
| 2025 | 0.10493827 | 0.16975309 |
| 2022 | 0.10950081 | 0.18035427 |
| 2023 | 0.10282258 | 0.16935484 |
| 2024 | 0.10223642 | 0.17252396 |
One row per year, with the two shares side by side. tc/pivot->longer turns those two column names into values of a :horizon column, and their numbers into a single :share column – which doubles the rows and gives :color something to name:
(def abandonment
  (-> abandonment-wide
      (tc/pivot->longer [:same-day :first-week]
                        {:target-columns    :horizon
:value-column-name :share})))abandonment_unnamed [34 3]:
| :year | :horizon | :share |
|---|---|---|
| 2014 | :same-day | 0.11647140 |
| 2015 | :same-day | 0.10784983 |
| 2020 | :same-day | 0.10251046 |
| 2012 | :same-day | 0.13344316 |
| 2011 | :same-day | 0.13793103 |
| 2013 | :same-day | 0.09286262 |
| 2009 | :same-day | 0.08256881 |
| 2010 | :same-day | 0.14629630 |
| 2019 | :same-day | 0.10896130 |
| 2016 | :same-day | 0.08958652 |
| … | … | … |
| 2009 | :first-week | 0.15137615 |
| 2010 | :first-week | 0.23148148 |
| 2019 | :first-week | 0.15478615 |
| 2016 | :first-week | 0.14318530 |
| 2017 | :first-week | 0.16469518 |
| 2018 | :first-week | 0.17457306 |
| 2021 | :first-week | 0.17880795 |
| 2025 | :first-week | 0.16975309 |
| 2022 | :first-week | 0.18035427 |
| 2023 | :first-week | 0.16935484 |
| 2024 | :first-week | 0.17252396 |
Each horizon gets its own line:
(-> abandonment
    (pj/lay-line :year :share {:color :horizon})
    pj/lay-point
(pj/options {:title "Share of a year's repositories never pushed to again"}))Both lines fall through the early years and then stop moving. About one Clojure repository in six is published and never touched again, and that has not changed since 2013.
The last year here is 2025, not 2026. A repository created three days ago cannot yet have gone a week without a push, so the current year would report an inflated share.
That is the tour. The rest of the post is about how these plots are put together, and why they are put together that way.
Background: the grammar of graphics
Leland Wilkinson’s The Grammar of Graphics (1999) made the case that statistical charts are not a list of chart types but a small set of parts that combine: data, a mapping from variables to visual properties, marks, statistical transformations, scales, coordinate systems, guides. Hadley Wickham’s ggplot2 turned that into a working R library, and a generation of people learned to think in its vocabulary. The browser libraries most of us reach for – Vega-Lite, Plotly, ECharts – carry more or less of the same ideas into JSON specifications.
Clojure has several libraries in this tradition already. Hanami brought Vega-Lite within reach by making its specifications into templates with substitution keys. Tableplot put a layered, pipeline-shaped API over both Vega-Lite and Plotly. Both compose plain Clojure data, and in both the picture is eventually drawn by a browser. Cljplot went the other way and drew on the JVM, through Clojure2D, with its own grammar of layers and scales. Plotje is not the first Clojure library to do either of those things.
What it settles on is a grammar of poses and layers, a five-stage pipeline whose intermediate values are all plain data, and Membrane as the drawing model – which means several rendering backends behind one description. Julia’s AlgebraOfGraphics.jl builds a plot by combining values with + and *, and Plotje works the same way with ordinary function calls. pj/cross, later in this post, is the clearest case: it gives every pair of two lists of columns, and the grid of panels follows from the pose that holds them.
This is also why the API looks the way it does. ggplot2 spells composition + and wraps mappings in aes(), so that a bare column name can be written without R trying to evaluate it before the call (similar to what one would do in Clojure with macros). Neither piece of machinery is needed in Clojure. A keyword is already a name that does not evaluate to a value, so a mapping is a map; and each step is an ordinary function call on the value the step before it returned, which -> lets you read top to bottom. Keep the grammar, and let ordinary function calls do the combining.
A pose is a value
Plotje calls the description of a plot a pose: the arrangement you settle into before the picture is taken. The functions that build one – pj/pose, the pj/lay-* family, pj/options, pj/scale, pj/facet – each take a pose, or the data to start one, and return a pose.
Here is the monthly line from earlier, printed instead of drawn:
(-> by-month
    (pj/lay-line :month :repos)
    (pj/options {:title "Clojure repositories created on GitHub, by month"})
kind/pprint){:layers [{:layer-type :line}], :data _unnamed [220 2]:
| :month | :repos |
|------------|-------:|
| 2008-04-01 | 1 |
| 2008-05-01 | 1 |
| 2008-06-01 | 1 |
| 2008-07-01 | 1 |
| 2008-09-01 | 2 |
| 2008-10-01 | 2 |
| 2008-11-01 | 9 |
| 2008-12-01 | 15 |
| 2009-01-01 | 14 |
| 2009-02-01 | 13 |
| ... | ... |
| 2025-10-01 | 26 |
| 2025-11-01 | 22 |
| 2025-12-01 | 30 |
| 2026-01-01 | 40 |
| 2026-02-01 | 38 |
| 2026-03-01 | 47 |
| 2026-04-01 | 39 |
| 2026-05-01 | 33 |
| 2026-06-01 | 24 |
| 2026-07-01 | 19 |
| 2026-08-01 | 7 |
,
:mapping {:x :month, :y :repos},
:opts {:title "Clojure repositories created on GitHub, by month"}}The dataset sits on :data. The mapping from columns to visual properties sits on :mapping: :month became the x aesthetic and :repos became y. The layers sit on :layers, in the order they were added. Plot options sit on :opts.
A pose does not need a dataset. Leave it out and what you have is a template, to be applied later to any table with the right columns:
(def stars-vs-forks
  (-> (pj/pose)
      (pj/lay-point :stars :forks {:alpha 0.5})
      (pj/scale :x :log)
      (pj/scale :y :log)))
The same template, applied first to the six libraries from the top of the post and then to the repositories with five hundred stars or more:
(pj/arrange
 [(-> (pj/with-data stars-vs-forks a-few-libraries)
      (pj/options {:title "Six libraries"}))
  (-> (pj/with-data stars-vs-forks popular)
(pj/options {:title (str (tc/row-count popular) " repositories")}))])Mappings and layers
A pose holds two kinds of thing, and both run through the whole library.
A mapping says which column becomes which visual property: :year becomes the x aesthetic, :license becomes color. A layer type says how the result is drawn – points, a line, a boxplot, a smooth – and consists of a mark (the shape drawn), a stat (a computation that runs first) and a position (how overlapping groups are adjusted).
A layer is a layer type placed on a pose. It can carry mappings of its own. A layer written without them uses the pose’s, which is how these two layers share one set of axes and one legend:
(-> licensed-by-year
    (pj/pose :year :repos {:color :license})
    pj/lay-line
pj/lay-point)A layer’s own mappings are added to the ones it inherits. Both layers still take :year, :repos and :color from the pose; the :size belongs to the point layer, and the lines are drawn as before:
(-> licensed-by-year
    (pj/pose :year :repos {:color :license})
    pj/lay-line
(pj/lay-point {:size 6}))Layers are drawn in the order they were added, so the points read on top of the lines.
Each of the built-in layer types has its own pj/lay-* function:
(-> (pj/registered-layer-types)
    keys
    sort
vec)[:area
:band-h
:band-v
:bar
:boxplot
:contour
:density
:density-2d
:errorbar
:histogram
:interval-h
:label
:line
:lollipop
:point
:ridgeline
:rug
:rule-h
:rule-v
:smooth
:step
:summary
:text
:tile
:violin]Scope
A mapping can be written on the pose or on a layer. Written on the pose, it reaches every layer on that pose – in both plots above, the lines and the points are split by license.
Written on a layer, it stops there:
(-> licensed-by-year
    (pj/pose :year :repos)
    (pj/lay-point {:color :license})
pj/lay-line)The points are colored by license, and the line is a single stroke zig-zagging through all four series at once, because the :license mapping never reaches the line layer and so gives it nothing to split by. It is an ugly plot on purpose: it is what “not grouped” looks like.
A layer can also refuse a mapping it would otherwise inherit, by setting it to nil. Here the pose splits by license and the point layer opts out:
(-> licensed-by-year
    (pj/pose :year :repos {:color :license})
    pj/lay-line
(pj/lay-point {:color nil}))This is lexical scope: mappings flow downward from pose to layer, and a lower one overrides a higher one.
Grouping follows the same rule. A categorical mapping splits every layer that sees it, so where you write the mapping decides which layers are split.
Identity
The layer functions have a second form that names columns directly. That raises a question a threading pipeline has to answer: when you call a second layer function, does the new layer join the plot you were building, or start a new one?
The rule is that a layer call naming columns in its argument slots looks for the most recent pose whose x and y mappings match, and attaches to it. In the two calls below the columns match, so the points and the smoothed trend land on one set of axes:
(-> by-month
    (pj/lay-point :month :repos {:alpha 0.4})
(pj/lay-smooth :month :repos))In the next two calls the columns do not match, so the second call starts a new pose. What comes back is no longer a single pose but a pose holding two poses – the same counts against the year, and against the license:
(def two-plots
  (-> licensed-by-year
      (pj/lay-point :year :repos)
(pj/lay-point :license :repos)))(mapv :mapping (:poses two-plots))[]Drawn, they become two panels sharing the repos axis, laid out as one row:
two-plotsOne -> thread can build either shape, and what you wrote decides which one you get. When you are not sure which you wrote, print it and look.
Datasets, and why they matter
The six libraries at the top of this post were a plain vector of maps. Everything since has been a dataset. Both work, because Plotje coerces whatever you hand it – a map of columns, a vector of row maps, a vector of row vectors – into a dataset first. Here are the same three rows in three of those shapes:
(def as-columns
  {:topic ["repl" "testing" "ring"]
:repos [68 67 61]})(def as-rows
[{:topic "repl" :repos 68}
{:topic "testing" :repos 67}
{:topic "ring" :repos 61}])(def as-dataset
(tc/dataset as-columns))as-dataset_unnamed [3 2]:
| :topic | :repos |
|---|---|
| repl | 68 |
| testing | 67 |
| ring | 61 |
(-> as-columns
(pj/lay-bar :topic :repos))Each of the three draws that chart, and a plot is a value, so the three can be compared:
(= (pj/plot (pj/lay-bar as-columns :topic :repos))
   (pj/plot (pj/lay-bar as-rows :topic :repos))
(pj/plot (pj/lay-bar as-dataset :topic :repos)))trueSo when is the dataset worth reaching for?
Dewey records the GitHub topics each repository declares, as a vector per row. Counting them is a Tablecloth pipeline:
(def top-topics
  (-> {:topic (mapcat identity (repos :topics))}
      tc/dataset
      (tc/group-by [:topic])
      (tc/aggregate {:repos tc/row-count})
      (tc/order-by :repos :desc)
      (tc/drop-rows (fn [row] (contains? #{"clojure" "clojurescript"} (:topic row))))
(tc/head 8)))top-topics_unnamed [8 2]:
| :topic | :repos |
|---|---|
| reagent | 148 |
| re-frame | 112 |
| babashka | 94 |
| react | 82 |
| clojure-library | 77 |
| repl | 68 |
| testing | 67 |
| ring | 61 |
Plotting it needs nothing further:
(-> top-topics
(pj/lay-bar :topic :repos))A dataset here means a tech.ml.dataset table, usually built and manipulated through Tablecloth: a columnar table backed by typed arrays, the Clojure counterpart of an R data frame or a pandas DataFrame. There are a few reasons to reach for one directly. In particular:
A column’s type decides how its values are read. The monthly line earlier has a calendar axis because of how its :month column is typed, which follows from the :parser-fn used when the data was read. Write the same months as strings and the type goes with them:
(def by-month-as-strings
  (-> by-month
      (tc/map-columns :month [:month] (fn [d] (subs (str d) 0 7)))))
[(tcc/typeof (by-month :month))
(tcc/typeof (by-month-as-strings :month))][:packed-local-date :string]The same two hundred and twenty bars come out of either column. From the dates:
(-> by-month
(pj/lay-bar :month :repos))And from the strings, which are two hundred and twenty categories and so have to be told how many labels to draw:
(-> by-month-as-strings
    (pj/lay-bar :month :repos)
(pj/scale :x {:n-ticks 8}))Compare the tick labels. The calendar axis picked 2010, 2012, 2014 and so on, because a date is a quantity, and ticks on a quantity fall on round values. The categorical axis spaced eight labels evenly along a list, which landed on 2010-09 and 2013-01 – regular, and meaningless as dates.
Neither plot is wrong. They are answers to different questions, and the column’s type is where the question is asked. The same distinction decides whether a color mapping gets a gradient or a palette, and how a number is formatted on a tick label. When you hand over plain Clojure data the types are inferred during coercion, and a column of "2020" strings is a different plot from a column of 2020 integers. A dataset is where you say which one you meant.
A dataset pipeline and a plot pipeline are the same pipeline. Both are -> over a value, so reshaping and plotting are one expression rather than two stages with a variable in between. Every plot in this post that starts from repos is doing that.
A mapping names a column, so the data has to be in long form. The six libraries are a small example of the shape most tables arrive in: :stars and :forks are two measurements of the same thing, sitting in two columns. To draw both on one chart, :color needs a column that says which measurement a number is, and there is no such column. tc/pivot->longer makes one:
(def libraries-wide
(tc/dataset a-few-libraries))libraries-wide_unnamed [6 4]:
| :library | :stars | :forks | :license |
|---|---|---|---|
| re-frame | 5541 | 711 | MIT |
| reagent | 4884 | 411 | MIT |
| babashka | 4586 | 274 | EPL-1.0 |
| ring | 3880 | 525 | MIT |
| hiccup | 2854 | 177 | EPL-1.0 |
| clj-kondo | 1848 | 305 | EPL-1.0 |
(def libraries-long
  (-> libraries-wide
      (tc/pivot->longer [:stars :forks]
                        {:target-columns    :measure
:value-column-name :count})))libraries-long_unnamed [12 4]:
| :library | :license | :measure | :count |
|---|---|---|---|
| re-frame | MIT | :stars | 5541 |
| reagent | MIT | :stars | 4884 |
| babashka | EPL-1.0 | :stars | 4586 |
| ring | MIT | :stars | 3880 |
| hiccup | EPL-1.0 | :stars | 2854 |
| clj-kondo | EPL-1.0 | :stars | 1848 |
| re-frame | MIT | :forks | 711 |
| reagent | MIT | :forks | 411 |
| babashka | EPL-1.0 | :forks | 274 |
| ring | MIT | :forks | 525 |
| hiccup | EPL-1.0 | :forks | 177 |
| clj-kondo | EPL-1.0 | :forks | 305 |
The column names became values in a :measure column, which is now something a mapping can name:
(-> libraries-long
(pj/lay-bar :library :count {:color :measure}))Performance is another reason, and it starts to matter past a few thousand rows. Columnar storage and typed arrays are what let Plotje work on dtype-next buffers rather than on sequences of boxed values.
Inference
A pose does not have to be complete. Leave a choice out and Plotje fills it in from the types of the columns you named.
One numerical column, and no layer at all, becomes a histogram. Here is the whole lifespan distribution behind that median, in years:
(-> repos
    (tc/map-columns :life-years [:life-days] (fn [d] (/ d 365.25)))
(pj/pose :life-years))A long tail reaching seventeen years, and most of the mass in the first two.
Two numerical columns become a scatter – the same two columns the labelled plot at the top of the post used, with nothing else said about them:
(-> a-few-libraries
(pj/pose :stars :forks))A categorical column against a numerical one becomes a boxplot. Take the five commonest values of :license:
(def licensed
  (-> repos
      (tc/select-rows (fn [row] (contains? #{"none" "MIT" "EPL-1.0" "EPL-2.0" "Apache-2.0"}
(:license row))))))licensed_unnamed [13427 12]:
| :full_name | :description | :stars | :forks | :issues | :size | :topics | :license | :archived | :created | :pushed | :life-days |
|---|---|---|---|---|---|---|---|---|---|---|---|
| LightTable/LightTable | The Light Table IDE ⛺ | 11689 | 912 | 181 | 19648 | [clojure clojure-development clojurescript editor ide lighttable] | MIT | true | 2012-06-27T22:32:43 | 2022-06-17T00:20:21 | 3641 |
| clojure/clojurescript | Clojure to JS compiler | 9389 | 782 | 7 | 18788 | [] | EPL-1.0 | false | 2011-07-20T23:29:13 | 2026-08-10T01:25:46 | 5499 |
| jepsen-io/jepsen | A framework for distributed systems verification, with fault injection | 7471 | 754 | 66 | 47977 | [] | none | false | 2013-04-14T19:20:27 | 2026-08-14T18:37:49 | 4869 |
| omcljs/om | ClojureScript interface to Facebook’s React | 6623 | 352 | 80 | 2181 | [] | none | false | 2013-12-11T18:18:11 | 2020-08-17T12:30:25 | 2440 |
| tonsky/datascript | Immutable database and Datalog query engine for Clojure, ClojureScript and JS | 5781 | 318 | 75 | 1962 | [clojure clojurescript database datascript memory-database] | EPL-1.0 | false | 2014-04-15T12:58:22 | 2026-08-15T16:29:25 | 4505 |
| day8/re-frame | A ClojureScript framework for building user interfaces, leveraging React | 5541 | 711 | 23 | 13435 | [clojurescript re-frame react reagent spa] | MIT | false | 2014-12-05T11:08:39 | 2026-05-05T15:55:07 | 4169 |
| reagent-project/reagent | A minimalistic ClojureScript interface to React.js | 4884 | 411 | 27 | 4441 | [clojure clojurescript frontend hiccup react reagent] | MIT | false | 2013-12-18T18:12:03 | 2026-01-23T13:16:19 | 4418 |
| babashka/babashka | Native, fast starting Clojure interpreter for scripting | 4586 | 274 | 40 | 12498 | [babashka bash clojure graalvm scripting shell-scripting] | EPL-1.0 | false | 2019-08-09T12:53:24 | 2026-08-15T18:47:05 | 2563 |
| riemann/riemann | A network event stream processing system, in Clojure. | 4267 | 505 | 29 | 7684 | [clojure events logging metrics monitoring monitoring-tool riemann] | EPL-1.0 | false | 2012-02-08T07:51:32 | 2026-04-05T20:42:18 | 5170 |
| weavejester/compojure | A concise routing library for Ring/Clojure | 4111 | 259 | 7 | 5866 | [clojure http ring routing] | EPL-1.0 | false | 2008-05-01T00:31:39 | 2025-09-15T14:44:43 | 6346 |
| … | … | … | … | … | … | … | … | … | … | … | … |
| Dale-Harrison/spouse-reminder | Server side code for spouse-reminder app | 1 | 0 | 0 | 1160 | [] | none | false | 2012-01-23T22:41:43 | 2012-03-20T21:59:01 | 56 |
| pgdad/clj-zoo-watcher | 1 | 0 | 0 | 132 | [] | none | false | 2012-03-10T00:59:59 | 2012-07-20T15:37:27 | 132 | |
| ryankohl/movies | A look at movie data | 1 | 0 | 0 | 2312 | [] | none | false | 2012-03-26T02:13:46 | 2012-05-14T11:49:08 | 49 |
| mjhogue/epicerie | 1 | 0 | 0 | 164 | [] | none | false | 2012-03-29T01:42:07 | 2012-04-01T18:37:34 | 3 | |
| longfin/warklet | Share link to twitter and facebook via bookmark. | 1 | 0 | 0 | 248 | [] | none | false | 2012-07-08T14:31:13 | 2012-08-07T17:41:55 | 30 |
| julienfantin/sndcld-clj | 1 | 0 | 0 | 112 | [] | none | false | 2012-06-23T21:28:25 | 2012-07-07T20:00:25 | 13 | |
| mikethayes/taken | taken | 1 | 0 | 0 | 104 | [] | none | false | 2012-06-26T17:25 | 2012-06-27T11:32:23 | 0 |
| watersofoblivion/pairing | 1 | 0 | 0 | 96 | [] | none | false | 2012-07-30T19:08:33 | 2012-07-30T19:08:42 | 0 | |
| enterlab/easy-xml | Small parsing library wrapping clojure.xml. Makes it a breeze to extract elements, texts and attributes from XML sources (URLs or pre-parsed with clojure.xml/parse). | 1 | 0 | 0 | 7 | [clojure xml] | EPL-1.0 | false | 2013-09-20T13:11:38 | 2019-02-18T12:05:16 | 1976 |
| relevance/fluxion | Asynchronous metric collection, aggregation, and delivery | 1 | 2 | 0 | 124 | [] | none | false | 2013-12-20T16:24 | 2014-01-31T21:17:53 | 42 |
| tailrecursion/warp | Exception handling control flow for Clojure. | 1 | 1 | 0 | 136 | [] | EPL-1.0 | false | 2014-01-07T19:56:22 | 2014-01-08T03:01:22 | 0 |
Most of the data, then. Against lifespan:
(-> licensed
(pj/pose :license :life-days))The median for repositories with no license is the lowest of the five by a clear margin, and Apache-2.0’s the highest, with MIT and the two EPLs close together in between.
None of the three poses above stored a layer. :layers is empty in all three, and the drawing recipe is chosen when the plot is drawn.
The principle is that inference fills in only what you left out. An explicit choice is always kept, so naming a layer type over the same two columns answers the same question a different way – pj/lay-summary draws the mean of each group with its standard error:
(-> licensed
(pj/lay-summary :license :life-days))Every mean is far above its median, because a small number of decade-old repositories drag it up. The two ends hold – repositories with no license stay lowest, Apache-2.0 highest – while the three in the middle change places: their medians were close together to begin with. Whether the medians or the means are the honest answer depends on the question; switching between the two was one word.
Inference covers marks, stats, color types, grouping, axis titles, and the mapping itself for datasets of one to three columns. The Inference Rules chapter lists the whole set.
Membrane, and the stages in between
A pose is a description; a plot is the rendered result. Between them Plotje runs five stages, and each transition is a public function you can call on its own.
| Stage | Produced by | What it holds |
|---|---|---|
| Pose | pj/pose, pj/lay-*, pj/options, … |
the description you wrote |
| Draft | pj/pose->draft |
the pose flattened: one entry per layer, with all inherited mappings merged in |
| Plan | pj/draft->plan |
resolved geometry: domains, ticks, legends, the output of every stat |
| Membrane | pj/plan->membrane |
drawing primitives placed on the canvas |
| Plot | pj/membrane->plot |
the format-specific result: SVG Hiccup, a BufferedImage |
pj/plot runs all five in order. pj/draft, pj/plan and pj/membrane stop early, which is how you inspect what a stage produced.
The fourth stage is the one this section is named after. Membrane is Adrian Smith’s Clojure UI library, and its central idea is that a user interface is data: a tree of shapes, text and images that different backends know how to draw. Plotje’s fourth stage produces one of those trees.
A PlotjeMembrane implements Membrane’s UI protocols, so a plot can be represented as a UI component. It renders through whichever backend you point at it – SVG and a Java2D BufferedImage are built in – and it can sit in a hand-built Membrane view, which is why putting a plot inside an Easel window is a matter of placing a component rather than embedding a picture.
Composite poses
A pose describing one panel is a leaf pose. A pose holding other poses is a composite, and it is the same kind of map. Composites are what multi-panel output is made of, and there are three ways in.
pj/facet, which we have already seen, splits one pose by a column.
pj/arrange tiles poses you have already built. They need not be related. Here are two views of the same repositories – when they were created, and when they were last pushed to:
(defn per-year [ds col]
  (-> ds
      (tc/add-column :year (fn [data] (dtype-dt/long-temporal-field :years (data col))))
      (tc/group-by [:year])
      (tc/aggregate {:repos tc/row-count})
      (tc/order-by :year)))
(pj/arrange
[(-> repos
(per-year :created)
(pj/lay-bar :year :repos)
(pj/options {:title "Created"}))
(-> repos
(per-year :pushed)
(pj/lay-bar :year :repos)
(pj/options {:title "Last pushed to"}))])Creation peaked in the middle of the 2010s and has fallen ever since. Last-push dates are spread far more evenly, and the tallest bar of all is the current year – the repositories that are still being worked on, whenever they were started.
pj/cross builds a scatterplot matrix. All three counts are long-tailed, so this takes the base-ten logarithm of each first:
(def logged
  (-> repos
      (tc/select-rows (fn [row] (and (>= (:stars row) 300)
                                     (pos? (:forks row))
                                     (pos? (:issues row)))))
      (tc/add-column :log-stars  (fn [ds] (tcc/log10 (ds :stars))))
      (tc/add-column :log-forks  (fn [ds] (tcc/log10 (ds :forks))))
(tc/add-column :log-issues (fn [ds] (tcc/log10 (ds :issues))))))logged_unnamed [491 15]:
| :full_name | :description | :stars | :forks | :issues | :size | :topics | :license | :archived | :created | :pushed | :life-days | :log-stars | :log-forks | :log-issues |
|---|---|---|---|---|---|---|---|---|---|---|---|---|---|---|
| tonsky/FiraCode | Free monospaced font with programming ligatures | 81922 | 3186 | 428 | 90653 | [font ligatures programming-ligatures] | OFL-1.1 | false | 2014-11-11T19:32:38 | 2026-07-28T17:02:16 | 4276 | 4.91340055 | 3.50324577 | 2.63144377 |
| penpot/penpot | Penpot: The open-source design platform for Product teams that need scalable collaboration. | 58654 | 3960 | 804 | 397669 | [clojure clojurescript design prototyping ui ux-design ux-experience] | MPL-2.0 | false | 2015-12-29T22:09:07 | 2026-08-14T18:16:22 | 3880 | 4.76829763 | 3.59769519 | 2.90525605 |
| metabase/metabase | The easy-to-use open source Business Intelligence and Embedded Analytics tool that lets everyone work with data :bar_chart: | 48782 | 6752 | 4327 | 2175565 | [analytics | NOASSERTION | false | 2015-02-02T19:25:47 | 2026-08-16T06:15:01 | 4212 | 4.68825960 | 3.82943243 | 3.63618690 |
| bi | ||||||||||||||
| business-intelligence | ||||||||||||||
| businessintelligence | ||||||||||||||
| clojure | ||||||||||||||
| dashboard | ||||||||||||||
| data | ||||||||||||||
| data-analysis | ||||||||||||||
| data-visualization | ||||||||||||||
| database | ||||||||||||||
| metabase | ||||||||||||||
| mysql | ||||||||||||||
| postgres | ||||||||||||||
| postgresql | ||||||||||||||
| reporting | ||||||||||||||
| slack | ||||||||||||||
| sql-editor | ||||||||||||||
| visualization] | ||||||||||||||
| logseq/logseq | A privacy-first, open-source platform for knowledge management and collaboration. Download link: http://github.com/logseq/logseq/releases. roadmap: https://logseq.io/p/NX4mc_ggEV | 44468 | 2770 | 961 | 179586 | [clojure | AGPL-3.0 | false | 2020-05-23T00:06:06 | 2026-08-16T06:36:45 | 2276 | 4.64804760 | 3.44247977 | 2.98272339 |
| clojurescript | ||||||||||||||
| git | ||||||||||||||
| graph | ||||||||||||||
| knowledge-base | ||||||||||||||
| knowledge-graph | ||||||||||||||
| local-first | ||||||||||||||
| markdown | ||||||||||||||
| note-taking | ||||||||||||||
| org-mode | ||||||||||||||
| pkm] | ||||||||||||||
| LightTable/LightTable | The Light Table IDE ⛺ | 11689 | 912 | 181 | 19648 | [clojure clojure-development clojurescript editor ide lighttable] | MIT | true | 2012-06-27T22:32:43 | 2022-06-17T00:20:21 | 3641 | 4.06777736 | 2.95999484 | 2.25767857 |
| clojure/clojurescript | Clojure to JS compiler | 9389 | 782 | 7 | 18788 | [] | EPL-1.0 | false | 2011-07-20T23:29:13 | 2026-08-10T01:25:46 | 5499 | 3.97261934 | 2.89320675 | 0.84509804 |
| jepsen-io/jepsen | A framework for distributed systems verification, with fault injection | 7471 | 754 | 66 | 47977 | [] | none | false | 2013-04-14T19:20:27 | 2026-08-14T18:37:49 | 4869 | 3.87337874 | 2.87737135 | 1.81954394 |
| technomancy/leiningen | Moved to Codeberg; this is a temporary convenience mirror | 7297 | 1571 | 94 | 7596 | [] | NOASSERTION | false | 2009-11-01T05:50:07 | 2026-06-08T15:12:19 | 6063 | 3.86314435 | 3.19617619 | 1.97312785 |
| omcljs/om | ClojureScript interface to Facebook’s React | 6623 | 352 | 80 | 2181 | [] | none | false | 2013-12-11T18:18:11 | 2020-08-17T12:30:25 | 2440 | 3.82105476 | 2.54654266 | 1.90308999 |
| athensresearch/athens | Athens is no longer maintainted. Athens was an open-source, collaborative knowledge graph, backed by YC W21 | 6301 | 396 | 316 | 78287 | [hacktoberfest | NOASSERTION | false | 2020-03-31T01:29:41 | 2023-02-03T12:32:15 | 1039 | 3.79940948 | 2.59769519 | 2.49968708 |
| knowledge-base | ||||||||||||||
| knowledge-graph | ||||||||||||||
| knowledge-management | ||||||||||||||
| memex | ||||||||||||||
| notetaking | ||||||||||||||
| tools-for-thought] | ||||||||||||||
| … | … | … | … | … | … | … | … | … | … | … | … | … | … | … |
| puppetlabs/puppetdb | Centralized Puppet Storage | 306 | 226 | 28 | 29105 | [clojure puppet puppetdb] | Apache-2.0 | false | 2011-08-11T18:54:46 | 2025-07-22T16:28:59 | 5093 | 2.48572143 | 2.35410844 | 1.44715803 |
| cjohansen/portfolio | Component-driven development for Clojure | 305 | 20 | 9 | 1134 | [] | EPL-1.0 | false | 2022-10-25T14:26:59 | 2026-07-22T09:22:26 | 1365 | 2.48429984 | 1.30103000 | 0.95424251 |
| Factual/skuld | Distributed task tracking system. | 304 | 13 | 19 | 1286 | [] | none | false | 2013-07-29T21:38:55 | 2015-01-05T20:49:25 | 524 | 2.48287358 | 1.11394335 | 1.27875360 |
| xeqi/kerodon | interaction and testing library for html based ring apps. | 304 | 22 | 13 | 163 | [] | none | false | 2012-02-21T03:19:22 | 2023-11-15T04:25 | 4285 | 2.48287358 | 1.34242268 | 1.11394335 |
| funcool/buddy-auth | Authentication and Authorization facilities for ring and ring based web applications. | 304 | 69 | 9 | 756 | [] | Apache-2.0 | false | 2014-12-27T15:13:24 | 2022-01-26T21:27:04 | 2587 | 2.48287358 | 1.83884909 | 0.95424251 |
| stathissideris/dali | dali is a Clojure library for representing, exporting and manipulating the SVG graphics format. | 303 | 18 | 14 | 1374 | [] | none | false | 2012-08-24T22:55:15 | 2023-05-04T08:28:23 | 3904 | 2.48144263 | 1.25527251 | 1.14612804 |
| hyperfiddle/rcf | RCF – a REPL-first, async test macro for Clojure/Script | 302 | 14 | 36 | 1315 | [clojure clojurescript] | MIT | false | 2020-09-24T19:34:55 | 2026-06-26T20:28:47 | 2101 | 2.48000694 | 1.14612804 | 1.55630250 |
| tonsky/clj-reload | Smarter way to reload Clojure code | 302 | 12 | 3 | 281 | [clojure interactive-development repl] | MIT | false | 2024-01-29T19:12:48 | 2025-09-15T15:26:53 | 594 | 2.48000694 | 1.07918125 | 0.47712125 |
| filipesilva/create-cljs-app | Set up a modern CLJS web app by running one command. | 302 | 17 | 45 | 456 | [clj | MIT | false | 2019-10-15T20:55:18 | 2023-01-01T06:03:14 | 1173 | 2.48000694 | 1.23044892 | 1.65321251 |
| clj-kondo | ||||||||||||||
| cljs | ||||||||||||||
| clojure | ||||||||||||||
| clojurescript | ||||||||||||||
| create | ||||||||||||||
| hacktober | ||||||||||||||
| hacktoberfest | ||||||||||||||
| shadow-cljs | ||||||||||||||
| zprint] | ||||||||||||||
| taoensso/encore | Core utils library for Clojure/Script | 301 | 57 | 1 | 3751 | [clojure clojurescript epl taoensso utilities] | EPL-1.0 | false | 2014-02-23T06:37:12 | 2026-07-29T12:49:15 | 4539 | 2.47856650 | 1.75587486 | 0.00000000 |
| Engelberg/better-cond | A version of cond that supports :let clauses, and a number of other conveniences. | 301 | 11 | 7 | 69 | [] | EPL-1.0 | false | 2016-06-28T08:16:28 | 2022-07-07T05:34:06 | 2199 | 2.47856650 | 1.04139269 | 0.84509804 |
The logarithms are the last three columns. pj/cross turns two lists of columns into the pairs the grid is built from – nine of them here, three of which name the same column twice and become the diagonal:
(def column-pairs
  (pj/cross [:log-stars :log-forks :log-issues]
[:log-stars :log-forks :log-issues]))column-pairs([:log-stars :log-stars]
[:log-stars :log-forks]
[:log-stars :log-issues]
[:log-forks :log-stars]
[:log-forks :log-forks]
[:log-forks :log-issues]
[:log-issues :log-stars]
[:log-issues :log-forks]
[:log-issues :log-issues])That list is what a pose accepts in place of a single :x and :y:
(-> logged
    (pj/pose column-pairs {:color :archived})
    (pj/options {:brush true
:title "Stars, forks and open issues, base-ten logarithms"}))Stars and forks move together tightly enough to read as one band. Open issues track either of them, but loosely.
The diagonal panels are histograms of each variable on its own.
This is where :brush earns its place. Drag a rectangle over one cell and the repositories inside it stay lit in all six scatters while the rest fade: every cell draws the same rows, each mark carries the row it came from, and the other cells read it.
All three of pj/facet, pj/arrange and pj/cross return poses. A composite can hold composites, and the outer pose’s data and mapping flow into the poses inside it – the same scope rule as before, one level up.
What comes next
Open threads, raised in the #plotje stream on Zulip:
Relating marks back to rows. Adrian Smith argued that the essential problem in interactive graphics is relating a drawn shape back to the data it came from, and that a mark should be able to say how it was derived – this row, this column, this binning, this scale. Work is under way on a plot index that answers exactly that: which rows of your data a drawn mark came from, so that a click on a histogram bar can name the rows in its bin. The tooltips earlier in this post are the shallow version of the same idea.
ClojureScript. Timothy Pratley asked about running Plotje in the browser, which would open up animation and richer interaction. The obstacle is that the dataset layer is JVM only. Nobody has taken it on.
Beyond those, the ordinary work: more chart types, better legends, and the items in the Known Limitations chapter, which is deliberately explicit about what does not work yet.
Where it stands, and what would help
org.scicloj/plotje {:mvn/version "0.10.1"}Plotje is alpha and heading for beta. The most useful thing anyone can do right now is take it somewhere it has not been – your data, your chart, your workflow – and report what breaks or reads badly. A plot that cannot be expressed, an option that behaves unexpectedly, an error message that does not help: all of it is worth an issue or a message, and all of it is cheaper to fix before the API settles.
The book: scicloj.github.io/plotje – every example rendered, from a Quickstart through a Gallery to the Known Limitations.
The source and the issue tracker: github.com/scicloj/plotje. A good share of the most recent release came out of reports and threads from people using it.
The conversation: the #plotje stream on the Clojurians Zulip, and the weekly Real-World Data meetings.